Plotting Air Conditions and Reading the Chart
A measured air condition becomes useful on a psychrometric chart when two independent properties are plotted at their intersection. Once the state point is located, the remaining moist-air properties can be estimated by following the correct line families to their scales.
This lesson plots dry-bulb temperature with wet-bulb temperature and with relative humidity, then reads humidity ratio, dew point, enthalpy, and specific volume from the resulting state point.
What You Will Learn
Prepare the correct chart and measurements before plotting.
Plot an air condition from dry-bulb and wet-bulb temperatures.
Plot an air condition from dry-bulb temperature and relative humidity.
Read humidity ratio, dew point, wet bulb, relative humidity, enthalpy, and specific volume.
Interpolate between printed lines without reporting false precision.
Recognize and correct common chart-reading errors.
Make Sure the Inputs Belong Together
The two properties used to locate a state point must describe the same air at the same location and time. Combining a return-air dry-bulb temperature with a supply-air wet-bulb temperature does not describe a real air state.
The chart must also match the job’s pressure or elevation, temperature range, and units. The examples in this lesson use an I-P normal-temperature chart at sea-level pressure of 29.92 inches of mercury, or 14.696 psia.
Verify the Airstream
Confirm whether the readings represent room, outdoor, return, mixed, entering-coil, or leaving-coil air.
Verify Stable Operation
Allow the equipment and instruments to stabilize unless the purpose of the test is to observe a changing condition.
Verify the Chart
Check pressure or elevation, temperature range, Fahrenheit or Celsius, and the units on each property scale.
The values must be independent, physically possible, and measured from the same air. For normal unsaturated air, wet-bulb temperature cannot be above dry-bulb temperature, and dew point cannot be above dry-bulb temperature.
Plot the Intersection of Two Temperature Lines
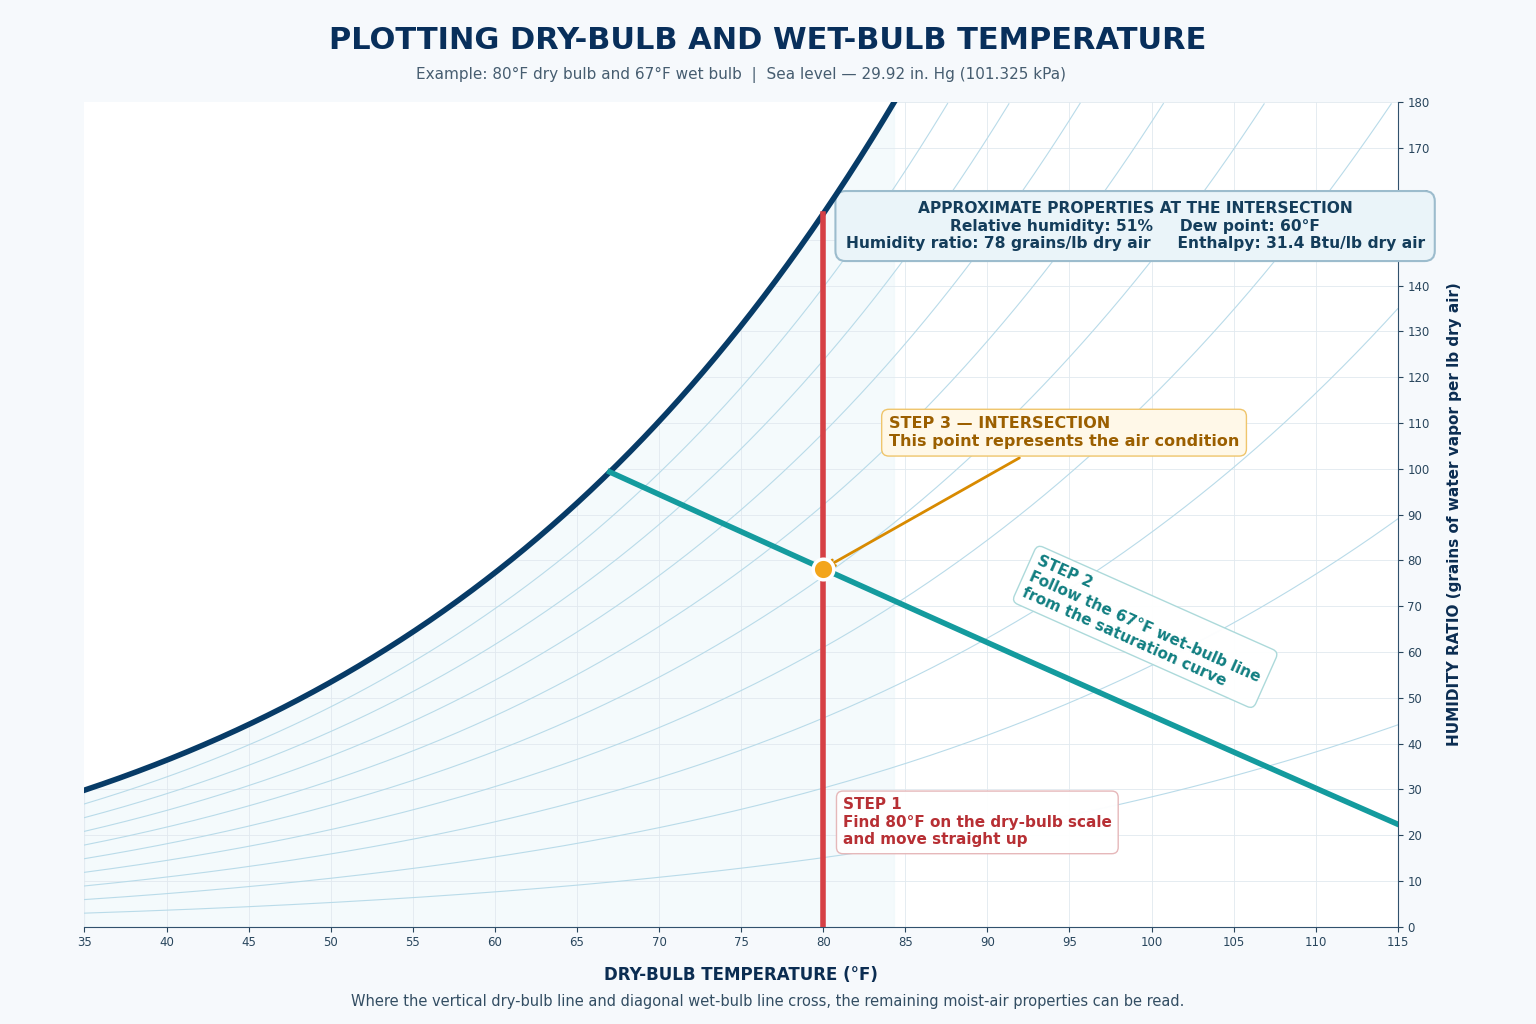
Dry-bulb and wet-bulb temperatures are a common psychrometric measurement pair. In this example, the air is 80°F dry bulb and 67°F wet bulb at sea-level pressure.
1. Locate Dry Bulb
Find 80°F on the bottom dry-bulb scale and follow its constant-temperature line upward through the chart.
2. Locate Wet Bulb
Find 67°F on the saturation curve and follow the constant wet-bulb line diagonally downward to the right.
3. Mark the Intersection
The point where the 80°F dry-bulb line and 67°F wet-bulb line cross represents the measured air condition.
Do not start at 67°F on the bottom dry-bulb scale and assume the nearby diagonal line is correct. Wet-bulb temperature is identified where its line begins on the saturation curve.
Plot the Intersection of a Straight Line and a Curve
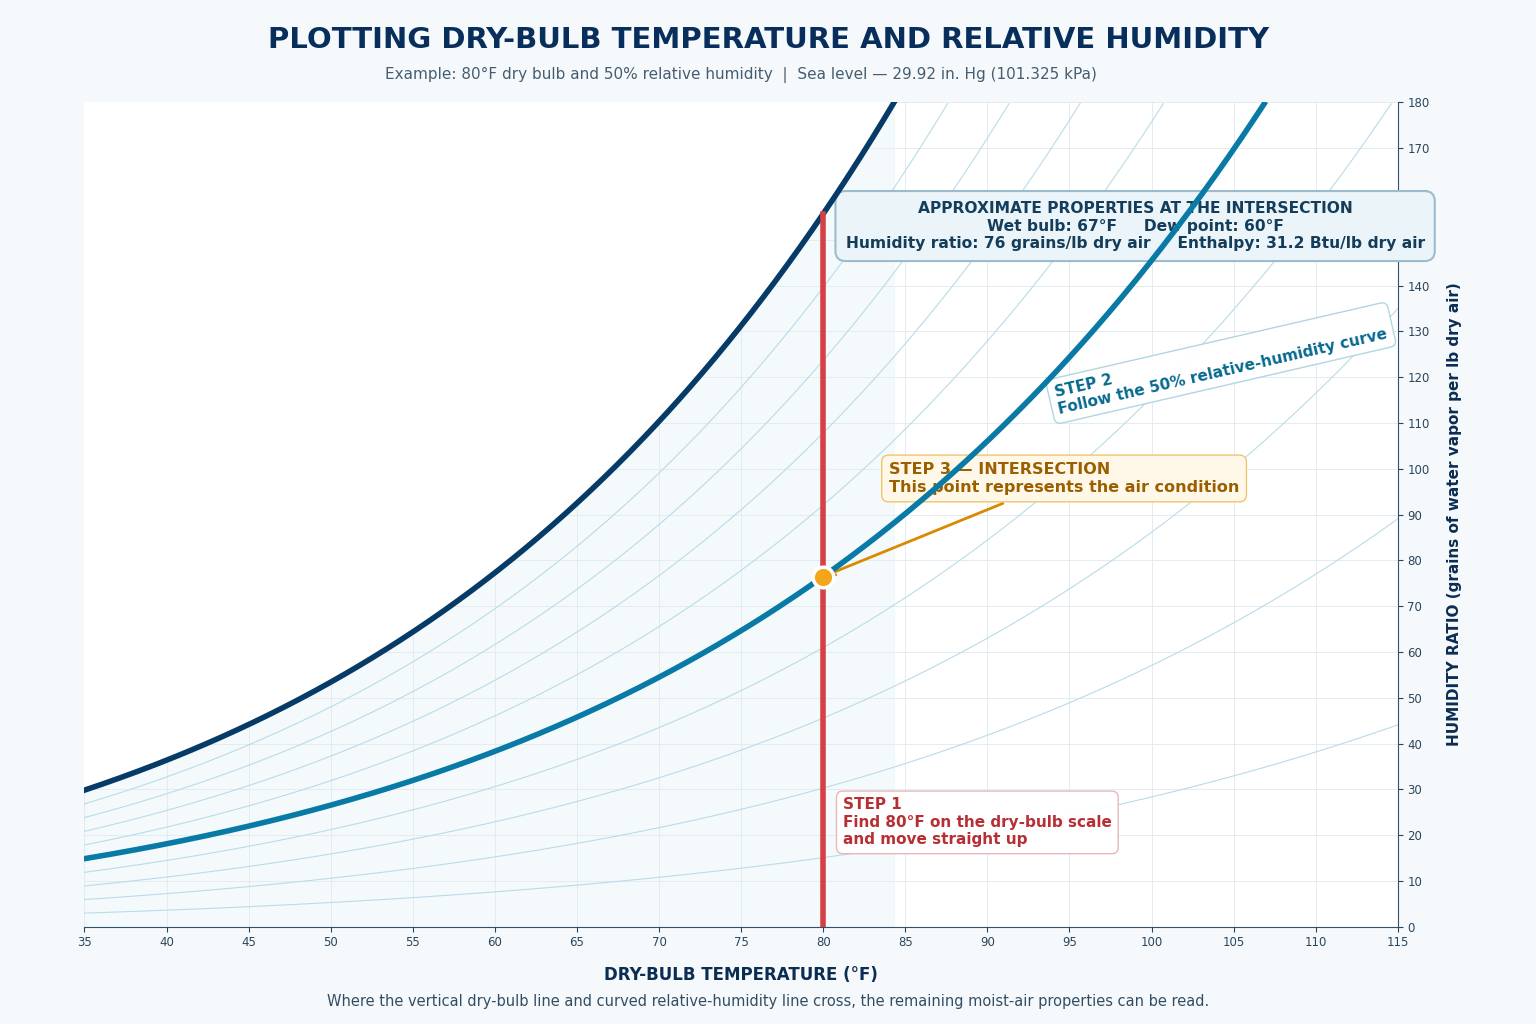
Dry-bulb temperature and relative humidity are another common pair, especially when using an electronic temperature and humidity instrument. In this example, the air is 80°F dry bulb and 50% relative humidity at sea-level pressure.
1. Locate Dry Bulb
Find 80°F on the bottom scale and follow the constant dry-bulb line upward.
2. Locate Relative Humidity
Identify the curved 50% relative-humidity line rather than a horizontal humidity-ratio line.
3. Mark the Intersection
The point where the 80°F line crosses the 50% curve represents the measured condition.
The percentage curves inside the chart represent relative humidity. The scale on the side represents humidity ratio, commonly expressed in grains of water vapor per pound of dry air on an I-P chart.
Read Every Property from the Same State Point
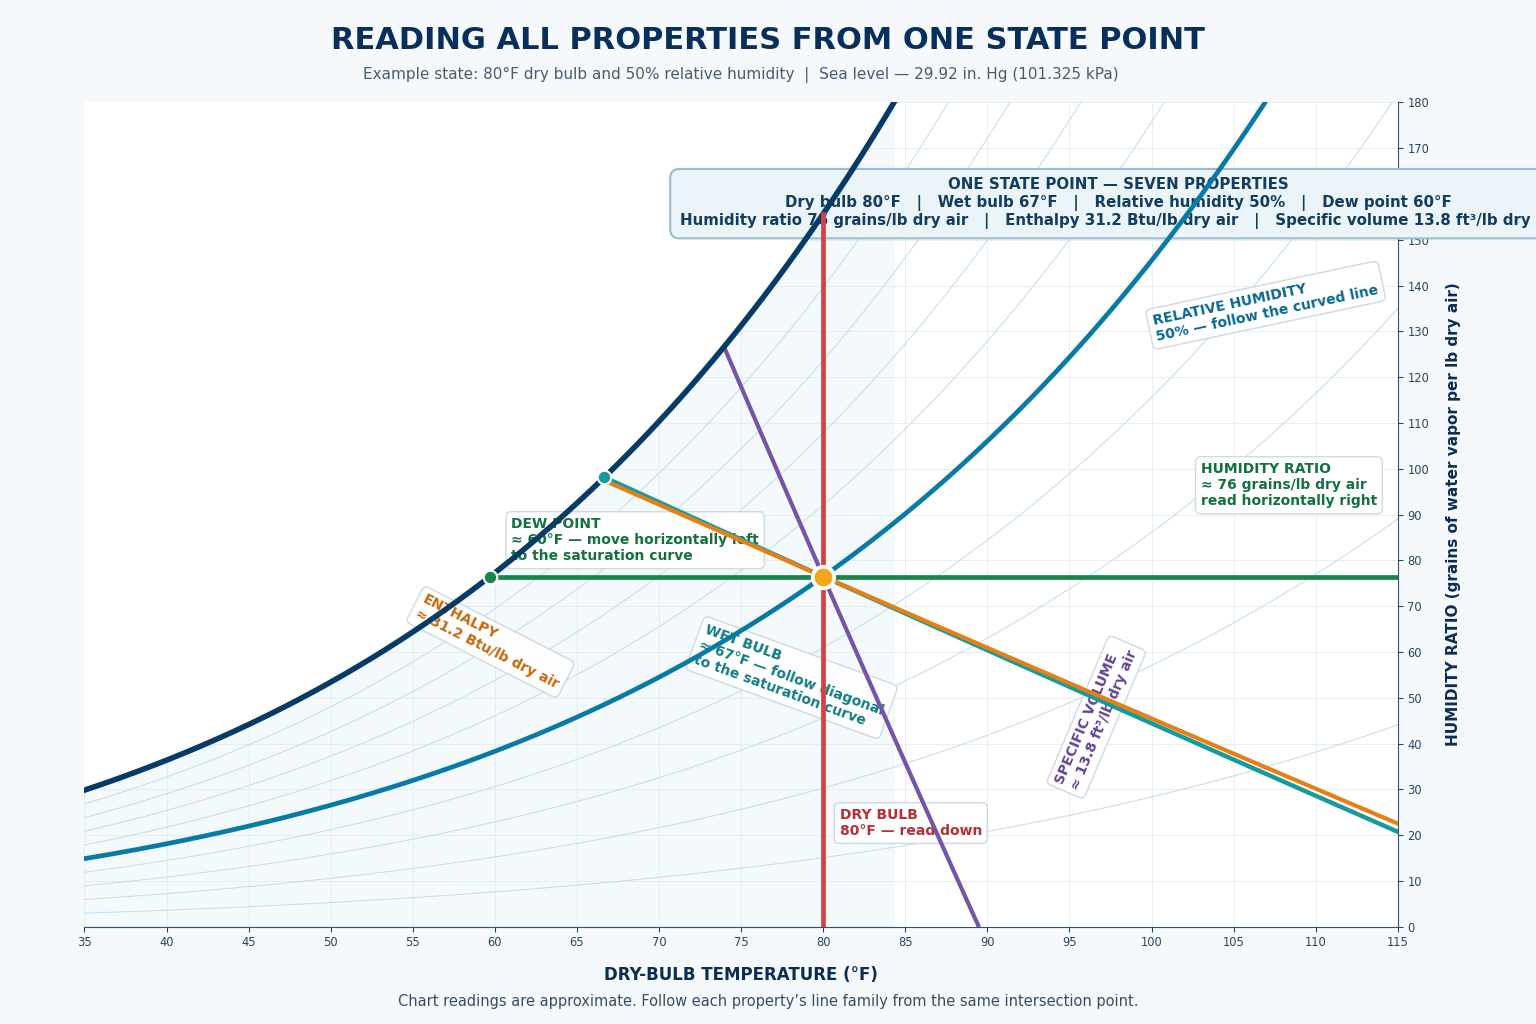
After locating a state point, leave the point fixed and follow each property line through it. For the 80°F dry-bulb and 50% relative-humidity example, the printed chart gives approximate values of 67°F wet bulb, 60°F dew point, 76 grains per pound humidity ratio, 31.2 Btu per pound of dry air enthalpy, and 13.8 cubic feet per pound of dry air specific volume.
Dry-Bulb Temperature
Follow the constant dry-bulb line downward to the bottom scale. The example reads 80°F.
Relative Humidity
Identify the curved percentage line passing through the point. The example lies on the 50% curve.
Humidity Ratio
Move horizontally from the point to the humidity-ratio scale. The example reads approximately 76 grains per pound of dry air.
Dew Point
Move horizontally left from the point to the saturation curve and read the temperature there. The example is approximately 60°F.
Wet-Bulb Temperature
Follow the wet-bulb line diagonally up and left to its value on the saturation curve. The example is approximately 67°F.
Enthalpy
Follow the enthalpy line in its printed direction to the enthalpy scale. The example is approximately 31.2 Btu per pound of dry air.
Specific Volume
Follow the specific-volume line through the point to its labeled value. The example is approximately 13.8 cubic feet per pound of dry air.
Chart-specific values: Enthalpy and other properties must be read using the units, reference basis, pressure, and line geometry printed on the selected chart. Values from different charts or software settings should not be mixed.
Use Dew Point to Establish Humidity Ratio
Dry-bulb temperature and dew point can also locate a state. Find the dew-point temperature on the saturation curve and move horizontally right along the constant humidity-ratio line. Then find the dry-bulb temperature and follow its line upward until the two lines intersect.
This method works because a state point and its dew point have the same humidity ratio at the same pressure. The horizontal line connects the unsaturated state with its saturated dew-point condition.
The bottom scale below the state point gives dry-bulb temperature. To read dew point, move horizontally left to the saturation curve and read the temperature at that intersection.
Estimate Between Printed Lines
A measured value often falls between two printed lines. Interpolation means estimating the value according to the point’s position between those lines. A point halfway between the 40% and 50% relative-humidity curves is approximately 45% relative humidity.
Interpolation does not make the chart more precise than its scale, line thickness, printing quality, or the original measurements. Report a value that the chart and instruments can reasonably support.
Approximately 60°F Dew Point
This wording recognizes that a hand-read printed chart provides an estimate.
59.7068°F Dew Point
A printed chart and ordinary field measurements do not justify this many decimal places.
Instrument accuracy, sensor placement, stabilization, chart selection, line thickness, and interpolation all affect the result. More digits do not correct uncertain inputs.
A Correct Point Can Still Produce a Wrong Answer
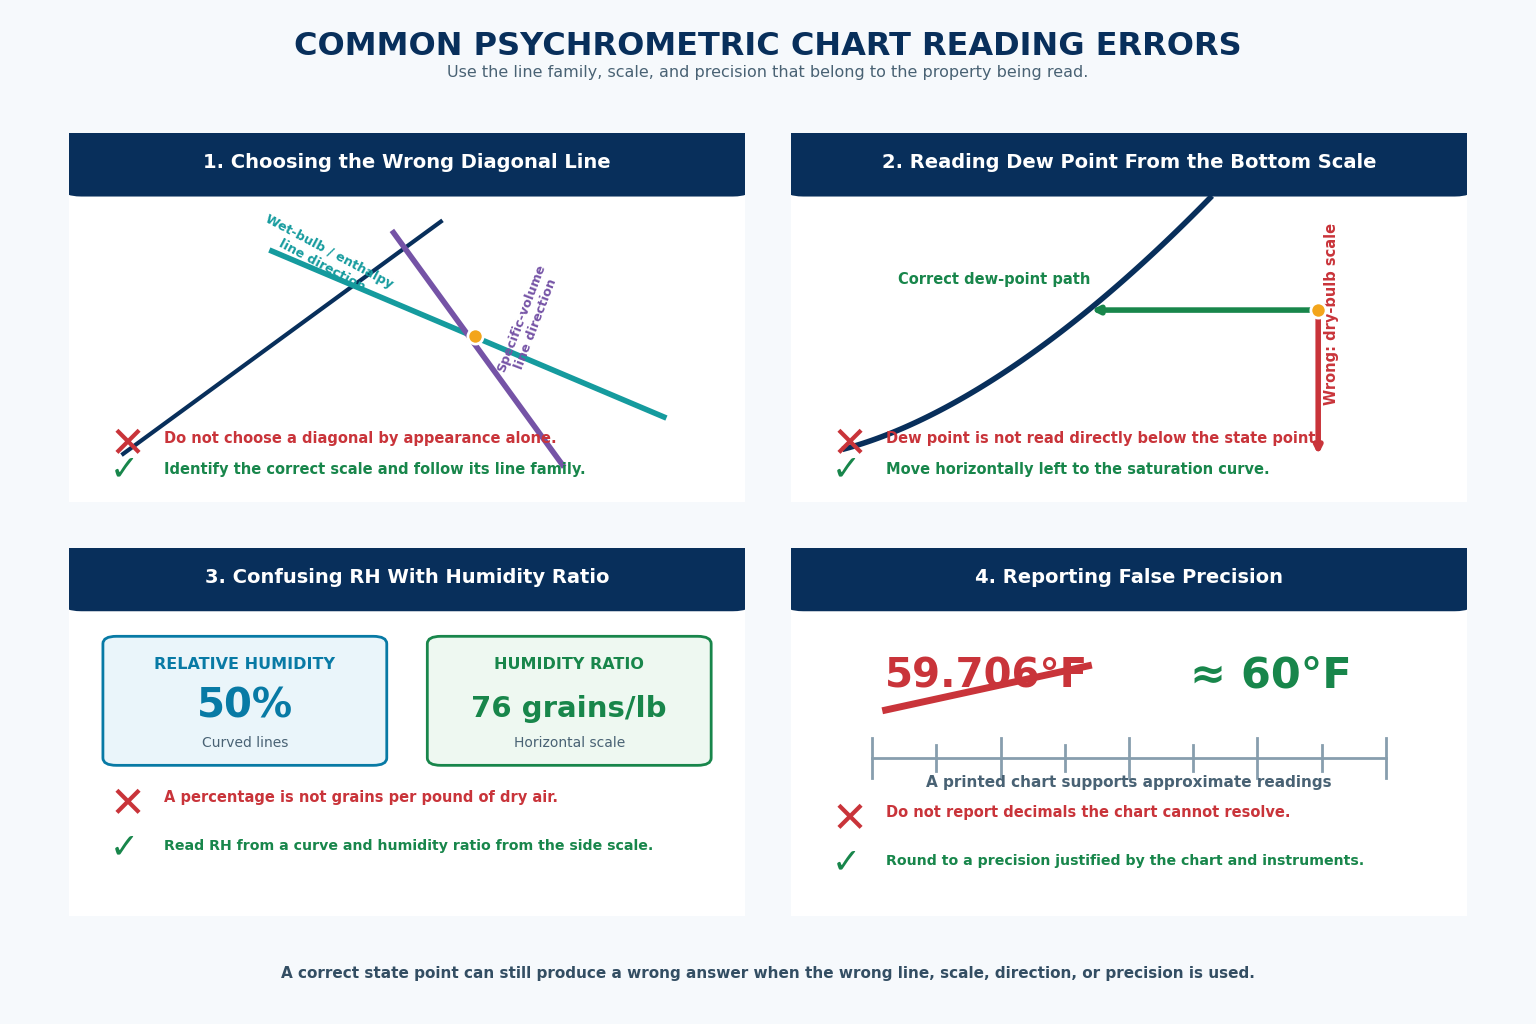
Choosing a Diagonal by Appearance
Wet-bulb, enthalpy, and specific-volume lines are diagonal. Identify the property scale and follow the correct line family.
Reading Dew Point from the Bottom
The temperature directly below the state point is dry bulb. Move horizontally left to the saturation curve for dew point.
Confusing RH with Humidity Ratio
Relative humidity is read from curved percentage lines. Humidity ratio is read horizontally from the side scale.
Reporting Unsupported Decimals
Round the result to a precision justified by the instruments and chart rather than copying excessive digits from a calculator.
Using the Wrong Pressure
A sea-level chart can give incorrect humidity ratio, enthalpy, and specific-volume results at a substantially different elevation.
Moving the Point for Each Property
All properties of one air state must be read from the same intersection point.
Use the Same Plotting Routine Every Time
1. Measure
Collect two independent properties from the same representative air condition.
2. Verify
Check instruments, stabilization, physical reasonableness, pressure or elevation, and units.
3. Plot
Follow both property lines carefully and mark their intersection.
4. Read
Follow each required property line from the same point to the correct scale.
5. Record
Write the location, operating condition, measured inputs, chart pressure, units, and approximate results.
6. Compare
Compare entering and leaving conditions or measured results with expected equipment performance.
Record which properties were measured directly and which were read or calculated from those measurements. Derived properties are not additional independent measurements.
Can You Plot and Read an Air State?
- What must be true of the two properties used to locate a state point?
- What chart information must be verified before plotting?
- How do you plot 80°F dry bulb and 67°F wet bulb?
- Where does a wet-bulb line begin?
- How do you plot 80°F dry bulb and 50% relative humidity?
- How is humidity ratio read from a state point?
- How is dew-point temperature read from a state point?
- Why is the temperature directly below the point not its dew point?
- Which diagonal line families are commonly confused?
- What does interpolation mean?
- Why should a hand-read chart value not be reported with excessive decimal places?
- Why should measured properties be identified separately from chart-derived properties?
What You Should Have Learned
Two independent properties measured from the same air condition locate one psychrometric state point.
Dry-bulb and wet-bulb temperatures are plotted where their constant-property lines intersect.
Dry-bulb temperature and relative humidity are plotted where the dry-bulb line crosses the correct percentage curve.
Humidity ratio is read horizontally from the side scale, while dew point is found by moving horizontally left to the saturation curve.
Wet bulb, enthalpy, and specific volume must each be read by following the correct diagonal line family.
All properties of one air condition must be read from the same state point.
Interpolation estimates values between printed lines but does not justify precision beyond the chart and measurements.
Field records should distinguish directly measured properties from values derived with a chart or software.