Component Pressure Drop and Restriction Diagnosis
Total external static pressure can show that the installed air path is too restrictive, but it does not identify where the resistance is concentrated. The technician locates the problem by dividing the system into smaller sections and measuring pressure differences across filters, coils, heat exchangers, accessories, ducts, fittings, dampers, grilles, and registers.
This lesson develops a technician-focused pressure-profile method: begin with verified system airflow and TESP information, measure each suspected section under the same operating condition, compare the result with valid manufacturer data or a documented baseline, and confirm the diagnosis after corrective work.
What You Will Learn
By the end of this lesson you should be able to:
Calculate component pressure drop.
Use upstream and downstream static-pressure readings correctly on both the positive supply side and negative return side.
Build a pressure profile.
Follow pressure from the return grille through the blower and supply system to see where resistance is consumed.
Evaluate common components.
Interpret pressure differences across filters, coils, heat exchangers, accessories, ducts, fittings, dampers, and terminals.
Use valid comparison data.
Compare measurements at the actual airflow with manufacturer information, design values, commissioning records, or verified clean baselines.
Avoid false conclusions.
Recognize how low airflow, area changes, poor probe locations, open panels, leakage, and operating changes can distort diagnosis.
Verify corrective work.
Repeat the original measurements and confirm airflow, equipment temperatures, safety limits, noise, and delivered performance.
Resistance Consumes Pressure
As air passes through a passive component, friction, turbulence, and changes in direction convert useful mechanical energy into heat and sound. The pressure difference across the component provides evidence of the resistance it creates at that operating airflow.
Higher Resistance
A dirty, blocked, undersized, closed, compressed, damaged, or poorly configured component can consume more pressure than expected at the same airflow.
Higher Airflow
Even a clean and correctly sized component normally produces more pressure drop as airflow increases. Pressure drop cannot be interpreted without considering airflow.
Lower Airflow
A restricted component may show only a modest pressure drop when system airflow has already fallen. A low reading does not automatically prove the component is clean or adequately sized.
Comparison Standard
Useful references include manufacturer pressure-drop data at the measured airflow, approved design values, commissioning readings, and a clean-system baseline obtained under the same conditions.
The same component can produce different pressure drops at different airflow rates. Do not condemn a filter, coil, heat exchanger, or duct section by comparing its reading with an unrelated rule of thumb.
Compare Upstream with Downstream
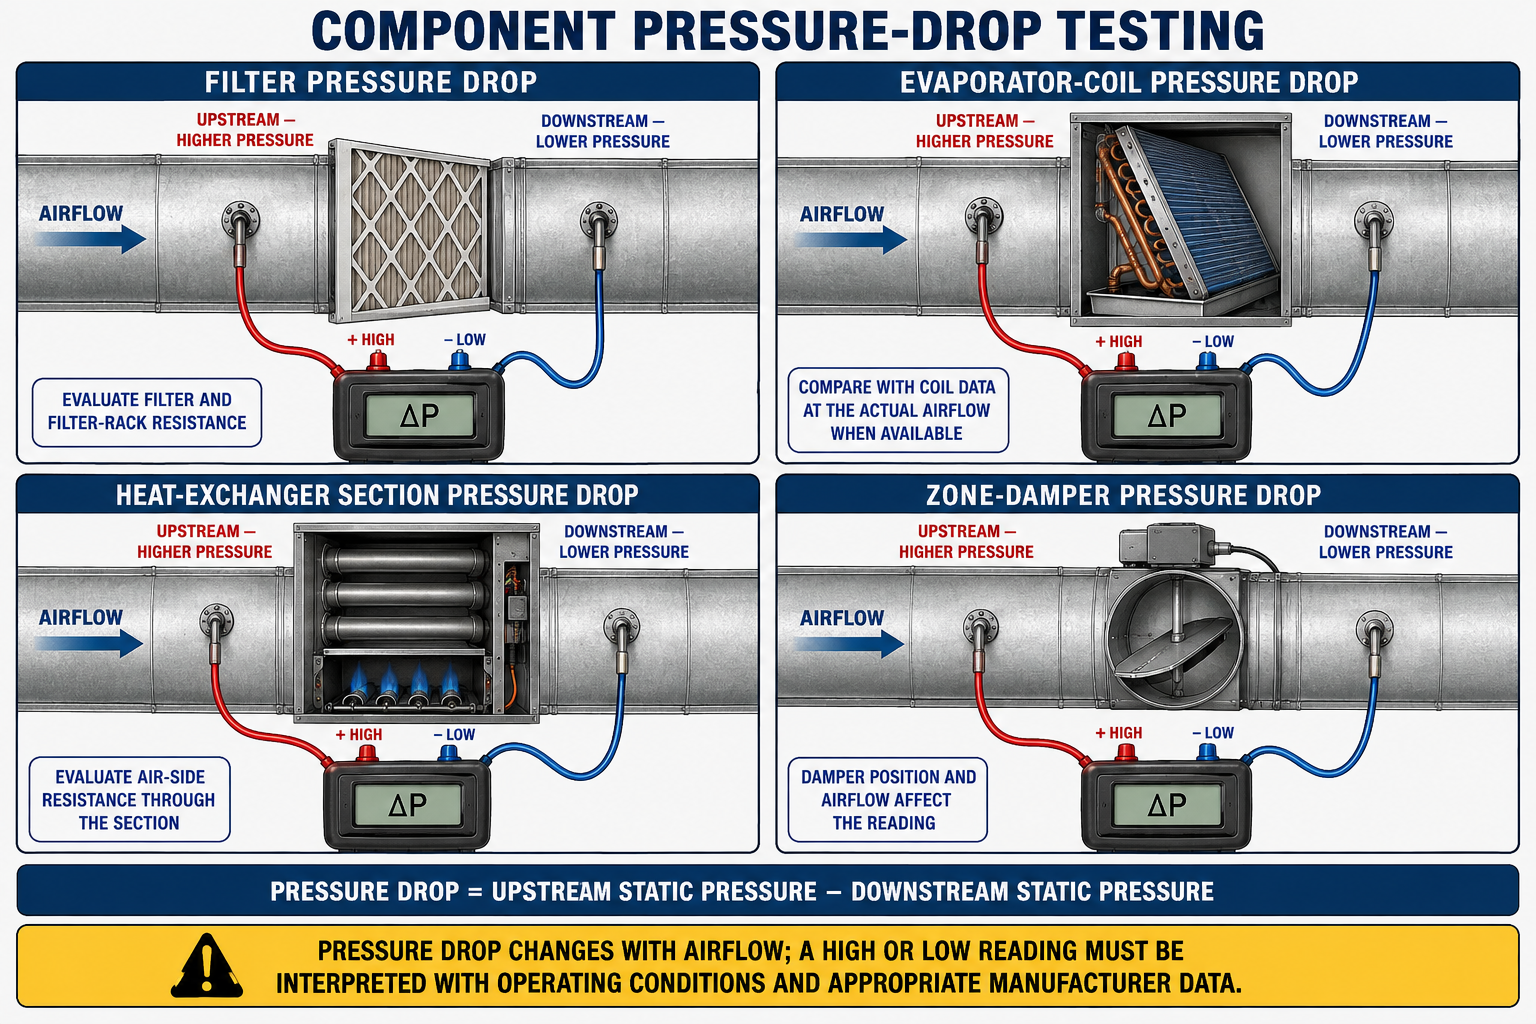
For airflow traveling from point 1 to point 2, component pressure drop can be calculated as upstream static pressure minus downstream static pressure when velocity conditions are comparable. A dual-port manometer can display the differential directly when its positive port is connected to the higher-pressure point and its negative port to the lower-pressure point.
ΔP = SPupstream − SPdownstream
Use signed values and keep the upstream and downstream locations in airflow order.
Higher Pressure to (+)
Connect the lower-pressure point to the negative port so a properly zeroed manometer displays a positive pressure-drop magnitude.
Static pressure is +0.52 in. w.c. before a component and +0.34 in. w.c. after it. The pressure drop is +0.52 − (+0.34) = 0.18 in. w.c.
Static pressure is −0.08 in. w.c. before a filter and −0.26 in. w.c. after it, following airflow toward the blower. The pressure drop is −0.08 − (−0.26) = 0.18 in. w.c.
Return static pressure commonly becomes more negative as air moves through a restriction toward the blower. Preserve the signs and subtract algebraically instead of adding numbers by appearance.
Make the Differential Represent the Component
Bracket Only the Target
Place the upstream and downstream probes so no unintended filter, transition, damper, fitting, grille, or duct length is included between them.
Avoid Disturbed Flow
Use manufacturer test ports when provided and avoid strong jets, recirculation zones, immediate elbows, abrupt transitions, and obstructions whenever the installation permits.
Compare Similar Velocity Conditions
Static pressure can change when duct area and velocity change even without an equivalent change in total pressure. Comparable upstream and downstream sections improve component-drop interpretation.
Use Correct Probe Orientation
Orient static probes according to their markings so sensing openings do not face directly into the airflow and add velocity-pressure error.
Never drill a test hole until the space behind the surface has been verified. Use approved existing ports when available, limit drill penetration, control shavings, and seal every field test port after testing.
Follow Pressure Through the Complete Air Path
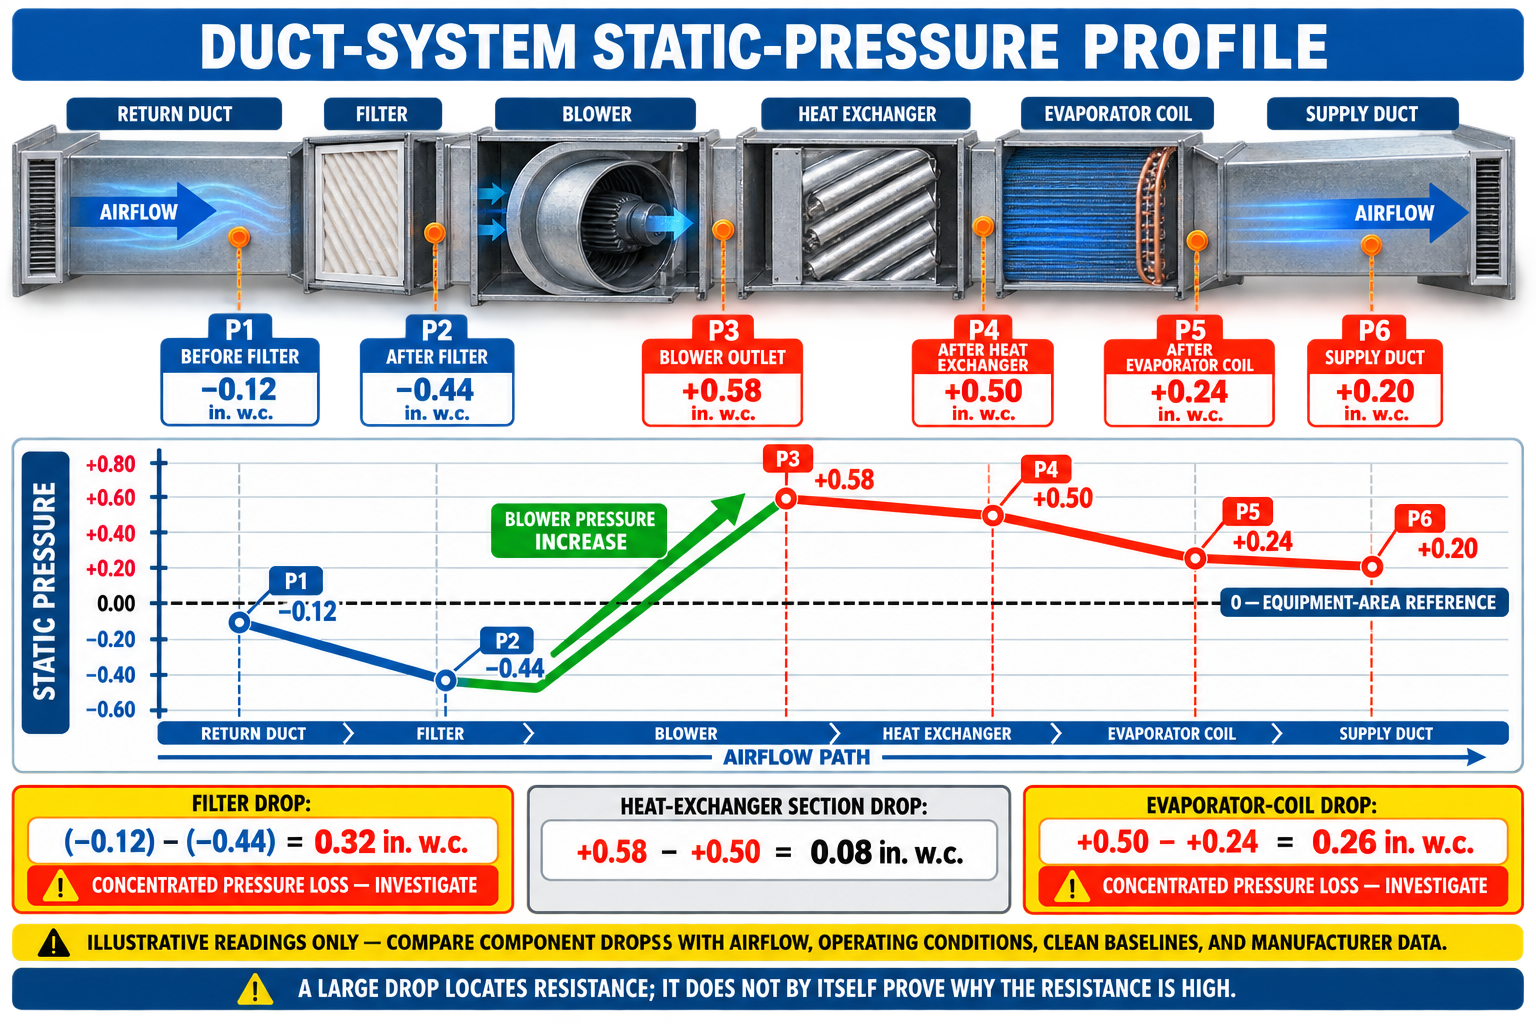
A pressure profile is a series of measurements taken at defined locations from the return side through the equipment and supply system. It shows how much of the available pressure is consumed by each section and helps separate a system-wide high-static condition into specific diagnostic targets.
Return Entry
Air begins near room pressure at a return grille and becomes more negative as it passes through grilles, filters, return ducts, fittings, and accessories toward the blower inlet.
Blower Rise
The blower adds mechanical energy, creating a large pressure increase from its inlet to outlet. This rise must support the resistance of the complete operating air path.
Supply Path
Air leaves the blower at positive pressure and loses pressure through heat exchangers, coils, plenums, ducts, fittings, dampers, branches, boots, grilles, and registers.
Room Discharge
At a supply outlet, remaining pressure is converted into discharge velocity and then dissipates as the air mixes with the room.
Total pressure decreases through passive components, but static pressure does not have to decrease at every individual point. A larger duct area can reduce velocity and convert some velocity pressure into static pressure, so evaluate fittings and transitions with suitable methods and locations.
Measure Resistance at the Installed Airflow
Measure immediately before and after the filter or filter bank while the system operates in the mode being diagnosed. Compare the result with the filter manufacturer’s pressure-drop data at the actual airflow and with a documented clean-filter baseline when available.
Loaded Media
Accumulated material generally increases filter resistance, but visible color alone does not establish the pressure drop or remaining service life.
Insufficient Area
A small filter face area increases velocity through the media and can create excessive pressure drop even when the filter is new.
Filter Construction
Media type, pleat design, depth, surface area, frame, and support structure affect resistance. Filters with the same nominal size or MERV rating can perform differently.
Rack and Bypass
A restrictive rack, crushed filter, poor transition, or blocked grille can add resistance, while bypass around an undersized or poorly sealed filter can make the measured filter drop appear lower.
MERV describes particle-capture performance, while pressure drop describes resistance at an airflow. Lesson 11 examines filter efficiency, media area, loading, rack sealing, and system capability in detail.
Compare with the Correct Coil Data and Condition
Evaporator and heat-pump coils have dense heat-transfer surfaces and can consume a substantial portion of available static pressure. Correct interpretation requires the exact coil model, orientation, installed airflow, and the wet or dry operating condition represented by the manufacturer data.
Surface Loading
Dust, lint, biological growth, pet hair, construction debris, and material carried past a poorly fitted filter can block the entering face or accumulate within the coil.
Condensate and Ice
A wet coil can have a different pressure drop from a dry coil, while ice or frost can rapidly increase restriction and reduce airflow.
Coil Selection and Installation
An undersized coil, mismatched cabinet, blocked air path, poor transition, mispositioned drain pan, or improperly installed internal accessory can increase resistance.
Low Drop with Poor Performance
Low airflow can produce a low coil pressure drop even when the coil is dirty. Combine pressure with blower-table airflow, direct airflow evidence, temperature, and visual inspection.
Airflow problems can change suction pressure, superheat, temperature split, coil temperature, dehumidification, and frost behavior. Establish acceptable air-side operation before drawing refrigerant-charge conclusions.
Restriction Can Affect Heating Safety
Gas-Furnace Heat Exchanger
Air-side restriction can result from debris, construction material, internal damage, an incorrect cabinet or coil combination, or airflow paths blocked during installation or repair.
Electric Heat Kit
Incorrect heater installation, displaced limits, damaged racks, wiring position, debris, or an unapproved kit can obstruct the air path and affect temperature rise.
Hydronic Heating Coil
Air-side fouling, bent fins, blocked face area, incorrect coil size, or poor transitions can increase resistance independent of water-side performance.
Pressure and Temperature Together
Use pressure drop with verified airflow, temperature rise, limit operation, combustion testing, and manufacturer requirements as applicable to the equipment.
High temperature rise, limit cycling, rollout operation, combustion spillage, unusual flame behavior, or suspected heat-exchanger damage requires appropriate safety procedures and manufacturer-directed diagnosis. Pressure testing does not replace combustion or heat-exchanger inspection.
Locate Resistance Between Accessible Stations
Individual elbows and takeoffs are not always accessible for direct testing, but technicians can bracket longer duct sections and compare pressure at trunks, branches, plenums, and terminal points. A large loss across a section directs the physical inspection toward the fittings and duct conditions located between the probes.
Flexible Duct
Compression, sag, excess length, tight bends, damaged inner liner, crushed sections, poor support, and undersized connections can create substantial resistance.
Metal Duct and Fittings
Undersized trunks, abrupt transitions, square elbows without suitable turning treatment, poor takeoffs, internal obstructions, and excessive fitting losses can consume pressure.
Dampers and Zoning
Closed balancing dampers, failed zone dampers, incorrect bypass operation, actuator faults, and control sequences can change resistance dramatically between operating calls.
Grilles and Registers
Restricted grilles, small free area, clogged screens, closed blades, furniture, rugs, dust buildup, and poor boot transitions can limit airflow and generate noise.
Pressure measurements identify which section deserves attention. Visual inspection, camera access, damper verification, dimensional checks, and airflow measurements then identify the physical defect within that section.
Move from the Whole System to the Fault
Verify the complaint and setup.
Confirm operating mode, blower command, filter, panels, dampers, zones, registers, and the conditions under which the problem occurs.
Measure signed return and supply static.
Use correct ports and probe placement, calculate TESP, and compare it with the exact equipment rating and blower data.
Choose the higher-resistance side.
Use the separate return and supply readings to decide where detailed pressure profiling should begin, while recognizing that both sides may be excessive.
Measure component and section drops.
Bracket filters, coils, heat sections, accessories, trunks, branches, fittings, dampers, grilles, and registers as access and valid methods permit.
Compare with appropriate evidence.
Use manufacturer data at actual airflow, design information, commissioning results, clean baselines, and related temperature or airflow measurements.
Correct and verify.
Repair the confirmed defect, restore the system, repeat the original measurements, and verify safe equipment and distribution performance.
When safe and permitted, compare conditions methodically so the effect of a filter replacement, damper correction, duct repair, coil cleaning, or blower-setting change can be identified. Multiple simultaneous changes can hide the actual cause.
A Lower Pressure Drop Is Only One Result
Repeat TESP
Use the same test ports, operating mode, blower setting, filter, damper positions, and door conditions to compare before-and-after total external static pressure.
Repeat Component Drop
Confirm that pressure drop across the repaired or serviced component changed as expected at the resulting airflow.
Verify Airflow and Temperatures
Recheck blower-table or directly measured airflow, cooling temperature and humidity performance, heating temperature rise, and applicable manufacturer limits.
Verify Distribution
Confirm register delivery, return paths, room pressure, noise, zoning, and the original comfort complaint rather than ending the diagnosis at the equipment cabinet.
After resistance is reduced, airflow may rise substantially, especially with a PSC or constant-torque blower. Recheck blower setup, temperature rise, cooling operation, noise, and equipment limits rather than assuming the previous setting remains correct.
Avoid These Restriction-Diagnosis Mistakes
Condemning by TESP Alone
High TESP identifies excessive external resistance but does not reveal which component or duct section is responsible.
Ignoring Airflow
Pressure drop varies with airflow, so a component cannot be judged accurately without knowing or estimating the operating airflow.
Using Unrelated Limits
A rule of thumb or pressure value from another filter, coil, furnace, or duct system is not a substitute for applicable manufacturer or design data.
Including Extra Components
Test points that bracket a component plus a transition, fitting, duct section, or accessory cannot isolate the component’s resistance.
Removing the Filter as the Final Fix
Operating without required filtration can foul the blower, heat exchanger, and coil. Correct filter area, rack design, leakage, and filter selection while maintaining equipment protection.
Stopping After Pressure Improves
A successful repair must also produce acceptable airflow, equipment temperatures, safe heating operation, noise, room delivery, and customer comfort.
Can You Locate a Duct-System Restriction?
- Why does total external static pressure not identify the location of a restriction?
- How is pressure drop calculated from upstream and downstream signed static-pressure readings?
- If return static changes from −0.06 to −0.23 in. w.c. across a filter, what is the filter pressure drop?
- Why should test points bracket only the component being evaluated?
- How can a change in duct area complicate static-pressure comparison?
- What creates the major pressure rise in a duct-system pressure profile?
- Why can a dirty component show a low pressure drop when airflow is very low?
- What information is needed to evaluate evaporator-coil pressure drop correctly?
- Why does MERV rating not establish filter pressure drop?
- What flexible-duct installation defects can create excessive resistance?
- Why should air-side operation be corrected before refrigerant-charge diagnosis?
- What measurements should be repeated after a restriction is corrected?
- Why might blower setup need to be rechecked after resistance is reduced?
- What evidence confirms that the customer’s original problem has actually been corrected?
What You Should Have Learned
Component pressure drop is the difference between valid upstream and downstream readings obtained under the same operating condition.
Signed algebra correctly handles both positive supply pressure and increasingly negative return pressure along the airflow path.
A pressure profile shows where filters, coils, heat sections, accessories, ducts, fittings, dampers, and terminals consume available pressure.
Pressure drop must be compared at the actual airflow with applicable manufacturer data, design information, commissioning results, or a valid baseline.
A low pressure drop can indicate low resistance or low airflow, while a high drop can indicate restriction or excessive airflow.
Test points must isolate the target section and avoid area changes, turbulence, hidden components, poor probe orientation, and operating-condition changes.
Systematic diagnosis moves from TESP to the higher-resistance side, then to components and duct sections, and finally to physical inspection of the suspected fault.
Repair verification includes repeated pressure and airflow tests plus equipment temperatures, heating safety, noise, distribution, and resolution of the original complaint.