Thermal Imaging of PV Systems
Thermal imaging gives a PV service technician another way to identify abnormal operating conditions without immediately disconnecting circuits or making direct electrical contact. Temperature differences can help locate module hotspots, overheated connectors, abnormal terminations, and other areas that deserve closer investigation.
A thermal image, however, is evidence rather than a diagnosis. Sunlight, electrical load, reflections, viewing angle, wind, module temperature, surface characteristics, and other environmental conditions can influence what the camera displays. Useful thermal inspection therefore requires both proper technique and verification of abnormal findings.
Temperature Patterns Can Reveal Useful Evidence
Electrical current, solar irradiance, resistance, cell condition, shading, airflow, and equipment operation all influence temperature. A thermal camera converts infrared energy from a surface into an image that allows temperature differences to be compared.
For PV troubleshooting, the pattern is often more useful than one isolated temperature reading. Comparable modules, cells, connectors, conductors, fuses, and terminals operating under similar conditions should generally show reasonably similar thermal behavior.
An unexpected temperature difference can identify where the technician should look next.
What the Camera Is Actually Showing
A thermal camera does not see electrical current and it does not directly identify an electrical fault. It detects infrared energy emitted and reflected by surfaces and uses that information to display an apparent temperature pattern.
The technician interprets that pattern in combination with system configuration, operating conditions, visual inspection, monitoring information, and electrical measurements.
Temperature Difference
A warmer or cooler area may indicate a different operating condition from surrounding components.
Pattern
The shape and location of the temperature difference can provide clues about cells, modules, connectors, conductors, terminations, or equipment.
Comparison
Comparing similar components operating under similar conditions is often more useful than evaluating one temperature by itself.
Verification
A thermal finding should lead to additional inspection or testing rather than automatically becoming the final diagnosis.
Thermal Imaging Finds Differences
The camera can show that one area is behaving thermally differently from another. It cannot, by itself, tell the technician why.
Use the thermal pattern to develop the next diagnostic question, then verify the cause using appropriate visual, electrical, monitoring, or manufacturer diagnostic information.
The System Must Be Producing Useful Thermal Evidence
Many PV electrical defects generate heat because current is flowing through an abnormal resistance or because part of a module is operating differently from surrounding cells. If little solar energy is available and the system is producing very little current, some thermal differences may be difficult to detect.
Thermal inspections are therefore most useful when the PV system is operating under reasonably stable conditions with sufficient irradiance to produce meaningful electrical loading.
Solar Irradiance
Strong, reasonably stable sunlight generally provides better operating conditions for comparing PV modules and electrical components.
Cloud Changes
Rapidly changing cloud cover can change module temperature and electrical loading while the inspection is being performed.
Wind
Air movement can cool surfaces and reduce or change apparent temperature differences.
Recent Shading
A module or portion of an array that has recently moved into or out of shade may temporarily have a different temperature from neighboring equipment.
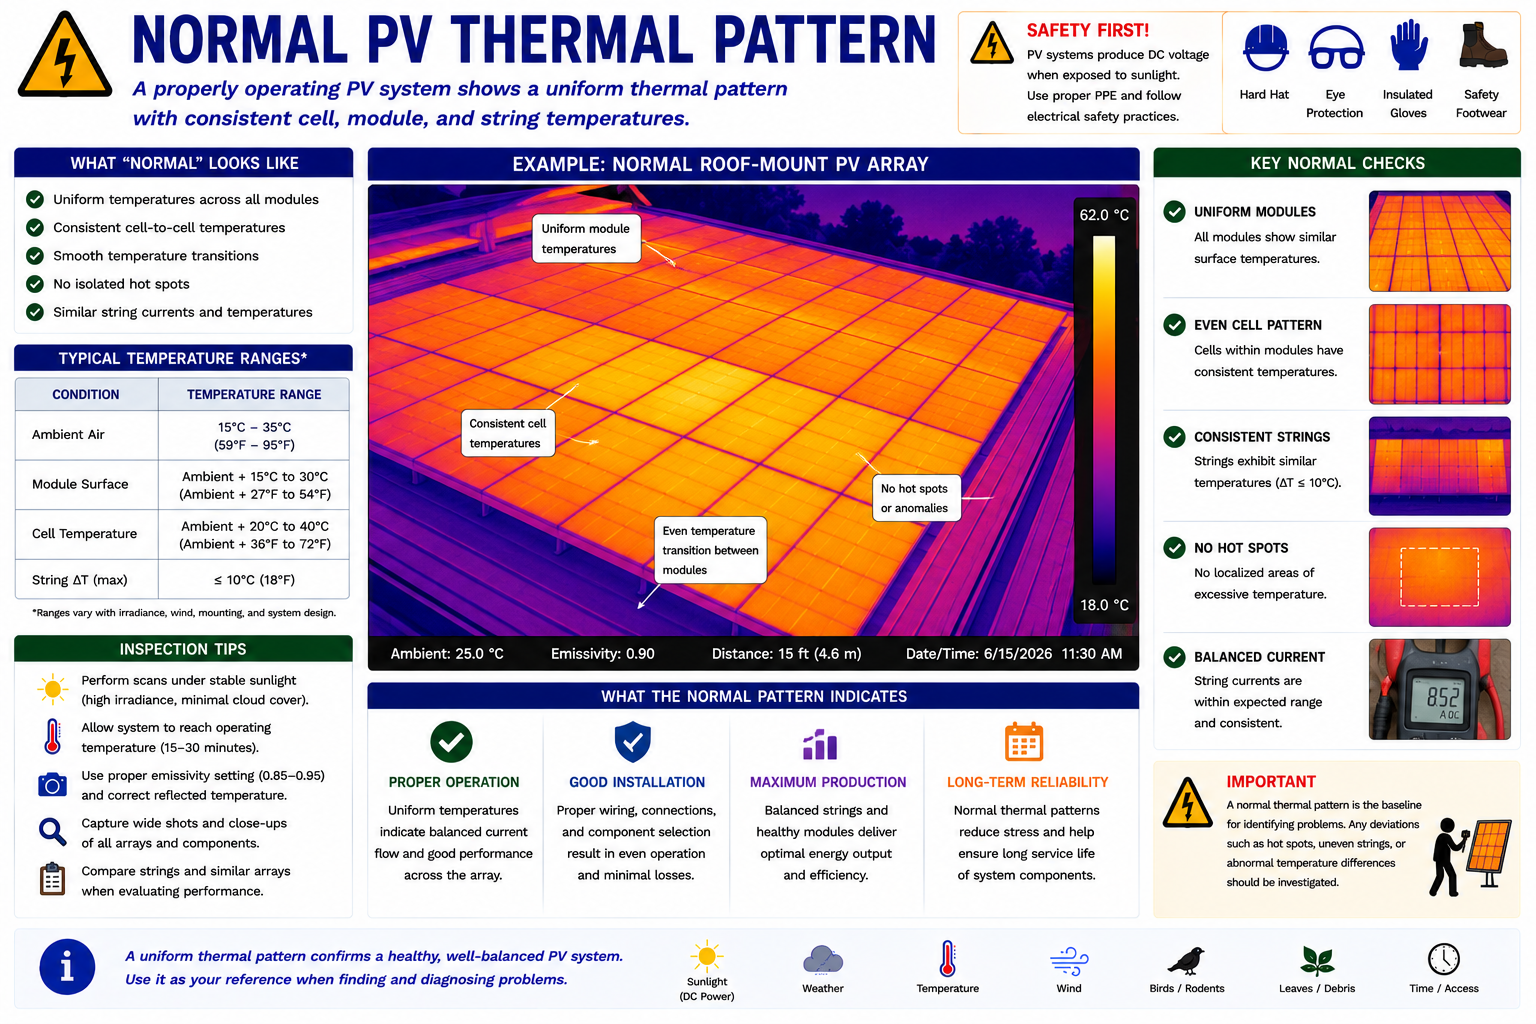
Learn What Normal Looks Like Before Identifying Abnormal
When similar modules are mounted together, exposed to similar sunlight, and operating normally, their overall thermal appearance should generally be reasonably consistent.
Perfectly uniform temperature should not be expected. Mounting, airflow, reflections, orientation, electrical loading, manufacturing characteristics, and environmental conditions can create normal differences.
Comparison is important: Compare a questionable module with neighboring modules that have similar orientation, shading, construction, and operating conditions.
A Localized Hot Area Deserves Investigation
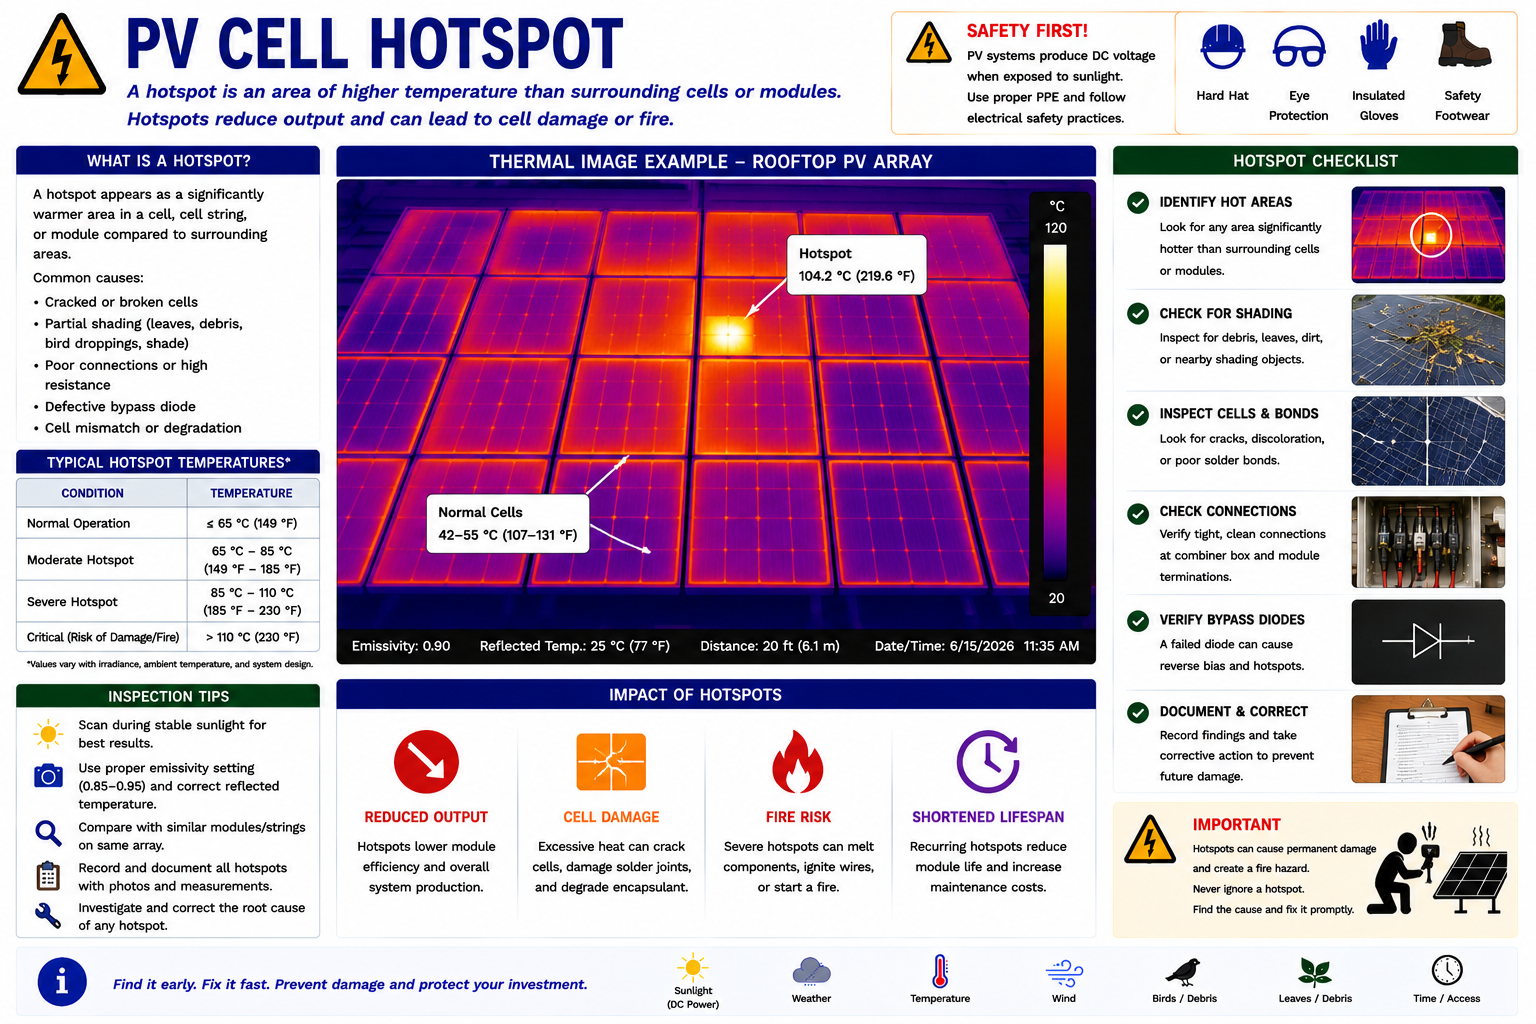
A hotspot is an area of a module operating at a higher temperature than the surrounding area. Depending on its shape and location, a thermal anomaly may be associated with cell damage, shading, contamination, electrical mismatch, interconnection problems, bypass-diode operation, or another condition.
The thermal pattern should be documented and compared with the visible condition and electrical performance of the module.
Ask Why the Area Is Hot
Confirm the Pattern
View the module from an appropriate angle and compare the apparent hotspot with surrounding cells and modules.
Check for Shading
Look for nearby objects, vegetation, debris, dirt, bird deposits, or other conditions affecting only part of the module.
Inspect the Module
Look for cracked glass, damaged cells, discoloration, delamination, impact marks, moisture, or other visible abnormalities.
Review Monitoring Data
Where module-level monitoring is available, determine whether the affected module also shows abnormal production or device behavior.
Verify Electrically if Required
Use appropriate electrical tests and manufacturer procedures to determine whether the thermal anomaly corresponds with an electrical problem.
Resistance Can Create Localized Heat
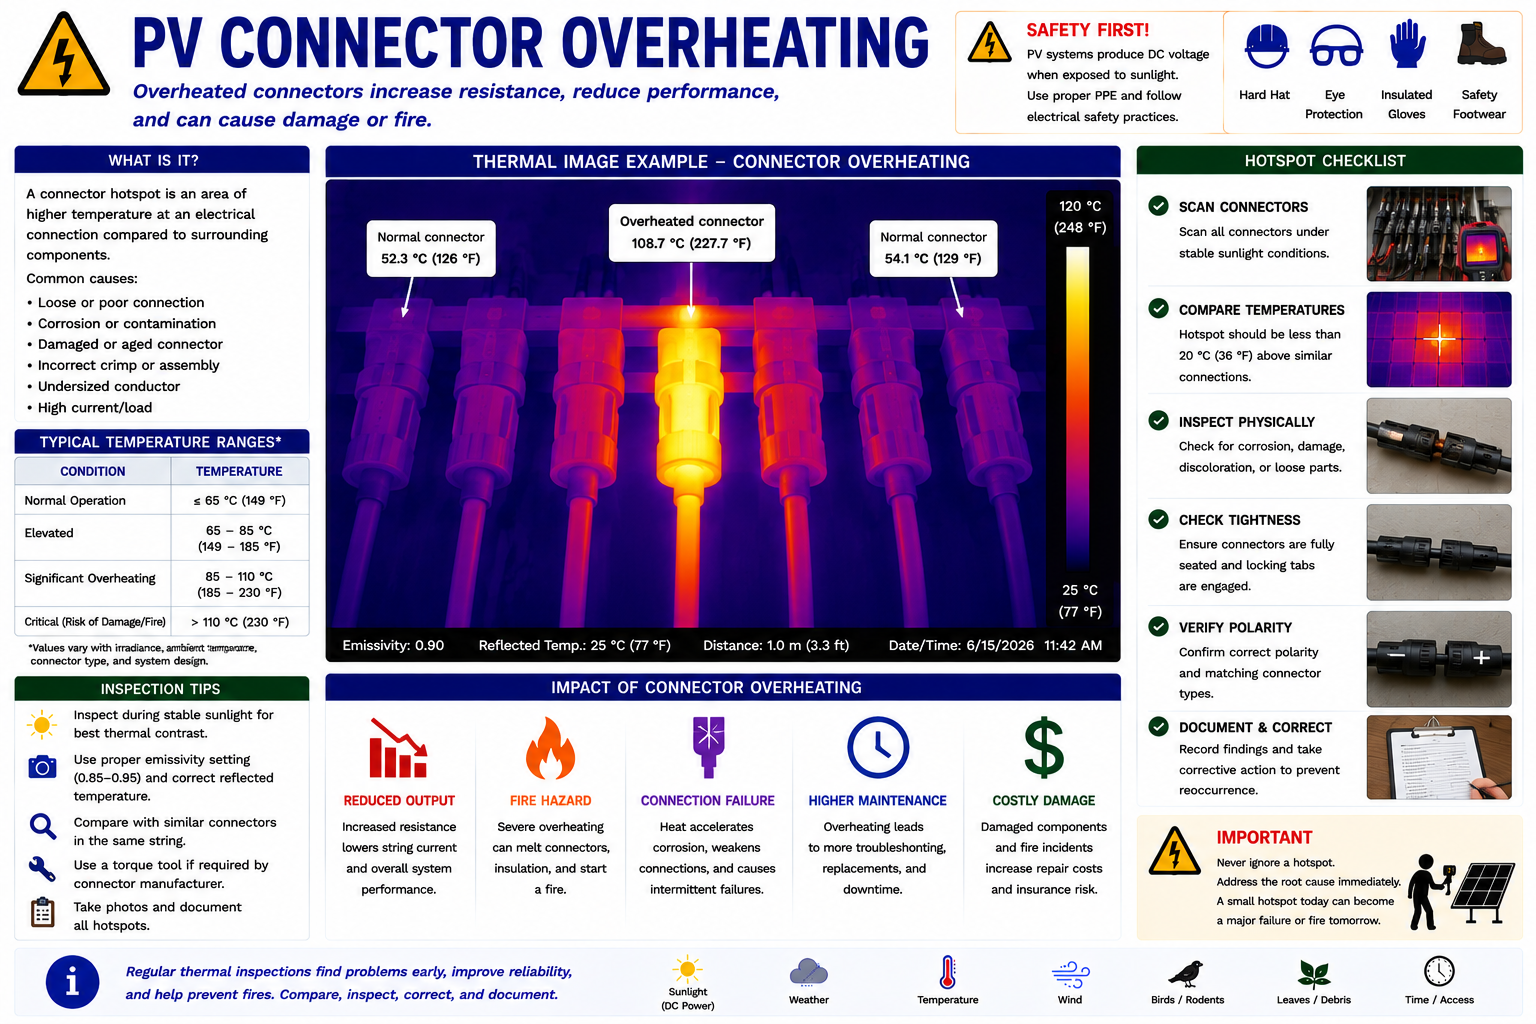
A PV connector or electrical termination can become hotter than surrounding conductors when abnormal resistance is present while current is flowing. Possible causes include poor contact, an improper crimp, corrosion, contamination, mechanical damage, incomplete engagement, or other connection problems.
Because the heating can initially occur before severe visible damage develops, thermal imaging can help identify a questionable connection for closer evaluation.
A Hot Connector Is a Finding — Not Yet the Cause
Thermal imaging may identify the connection where abnormal heating is occurring, but determining why it is hot requires additional investigation.
The technician may need to evaluate connector condition, compatibility, assembly, conductor termination, corrosion, current, and other factors before deciding on the proper repair.
Inspect More Than the Modules
Thermal imaging can also be useful when inspecting other current-carrying PV components. The most useful comparison is often between similar components carrying similar electrical load.
String Connections
Compare connectors and terminations serving similar strings for unexpected temperature differences.
Combiner Equipment
Compare fuse holders, terminals, breakers, and string conductors where the circuits are operating under comparable conditions.
Disconnects
Abnormal heating near contacts or terminations may indicate an area requiring closer inspection.
AC Connections
Inverter output conductors, breakers, terminals, and disconnects can also develop resistive heating.
Inverter Equipment
Thermal patterns can help identify unusual localized heating, blocked cooling, or differences between similar components where safely observable.
Battery Equipment
Battery systems can have their own thermal patterns and hazards. Battery-specific inspection and troubleshooting are addressed later in the course.
Reflections Can Look Like Heat
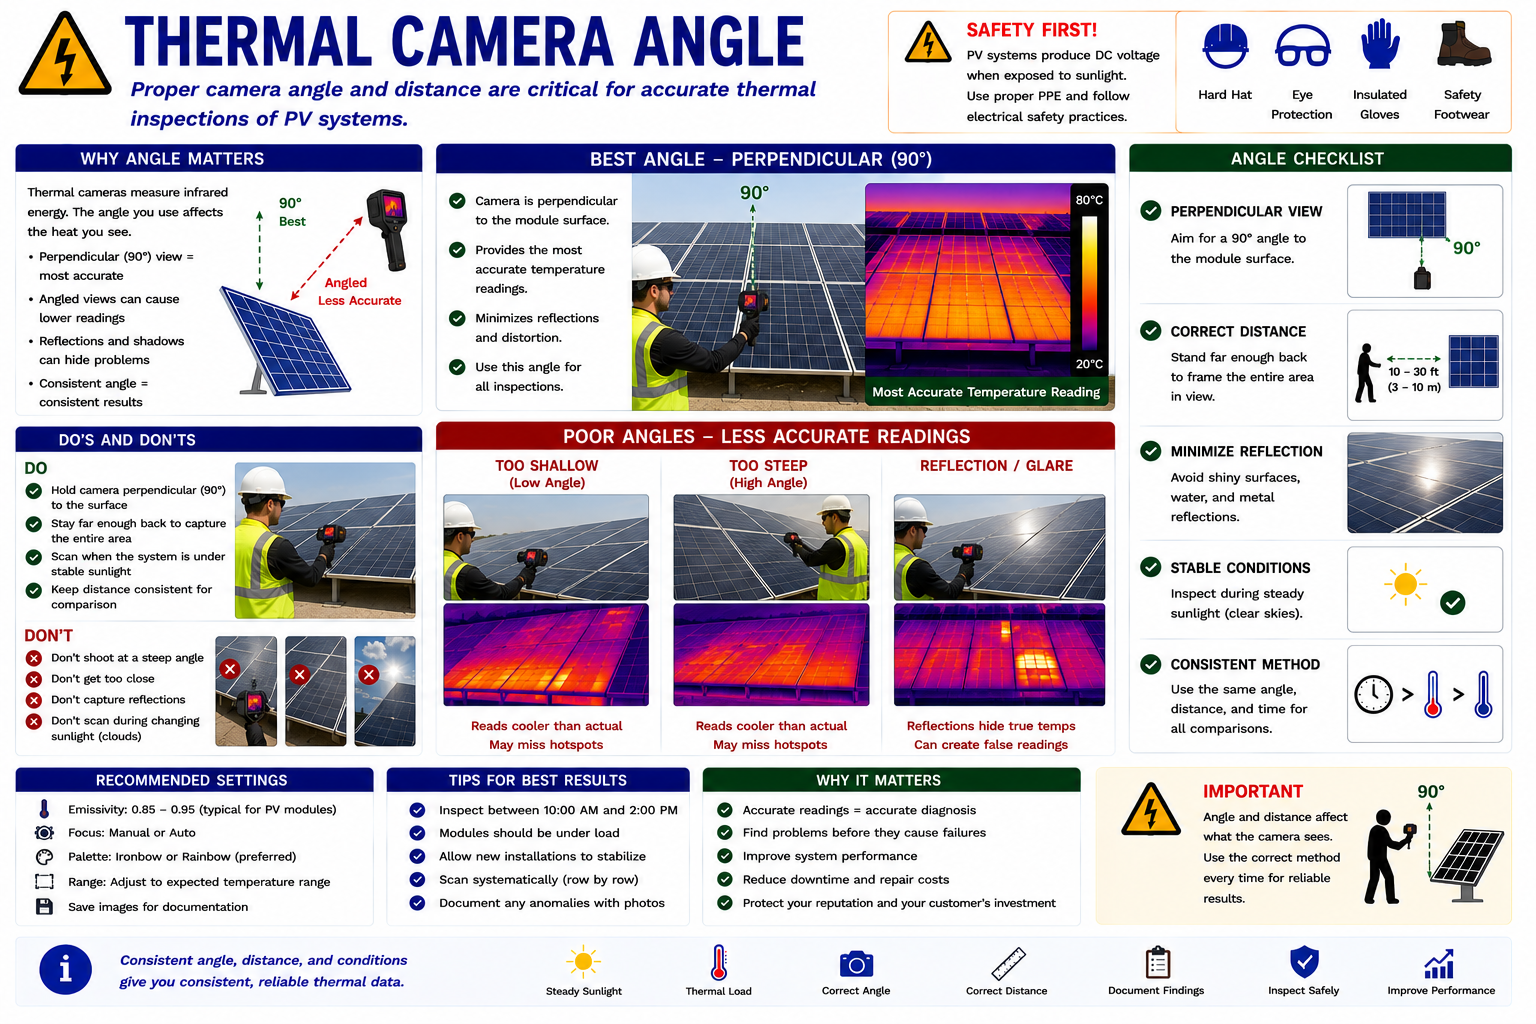
PV module glass is reflective. The apparent temperature displayed by a thermal camera can therefore be influenced by reflected infrared energy from the sun, sky, technician, nearby structures, or other objects.
A suspicious hot area that changes or disappears when the viewing angle changes may be a reflection rather than an actual module hotspot.
Move Before You Diagnose
Observe the Pattern
Identify the apparent thermal anomaly from the initial inspection position.
Change the Viewing Angle
Move to another safe position while maintaining a useful view of the same module or component.
Observe What Changes
If the apparent hot area moves substantially with the camera position, reflected energy may be influencing the image.
Verify the Location
An actual cell or connection problem should remain associated with the physical component rather than following the camera’s reflection angle.
Different Materials Do Not Always Read the Same Way
Thermal cameras estimate surface temperature based partly on the infrared characteristics of the material being viewed. Different materials can emit and reflect infrared energy differently.
Shiny metal surfaces can be particularly reflective and can produce misleading apparent temperatures. For field troubleshooting, relative comparison between similar surfaces under similar conditions is often more reliable than treating every displayed temperature as an exact physical measurement.
Technician point: Be cautious when comparing temperatures from surfaces made of different materials. A connector body, conductor insulation, glass module surface, and shiny metal enclosure do not necessarily behave the same way in a thermal image.
The Target Must Be Large Enough to Evaluate
A thermal image taken from a long distance may show the general pattern of an array but may not provide enough detail to evaluate an individual cell, connector, or termination accurately.
Use an appropriate inspection distance and camera capability for the target while maintaining safe access and electrical clearances.
Do not move into an unsafe position merely to obtain a closer thermal image.
Relative Temperature Can Be More Useful Than One Number
Suppose several similar string connections are operating under approximately the same current. If most appear thermally similar while one connection is substantially warmer, that difference provides useful diagnostic evidence.
The same principle applies to modules, cells, fuse holders, breakers, conductors, and other comparable components.
One Connection Is Different
Five comparable string connections show similar thermal patterns while a sixth connection is noticeably warmer. The thermal image does not prove why the sixth connection is hot, but it gives the technician a specific location to inspect and test.
Thermal Imaging Should Lead to Another Question
After locating an abnormal thermal pattern, determine what additional evidence will confirm or reject the suspected fault. The appropriate verification depends on the component and system architecture.
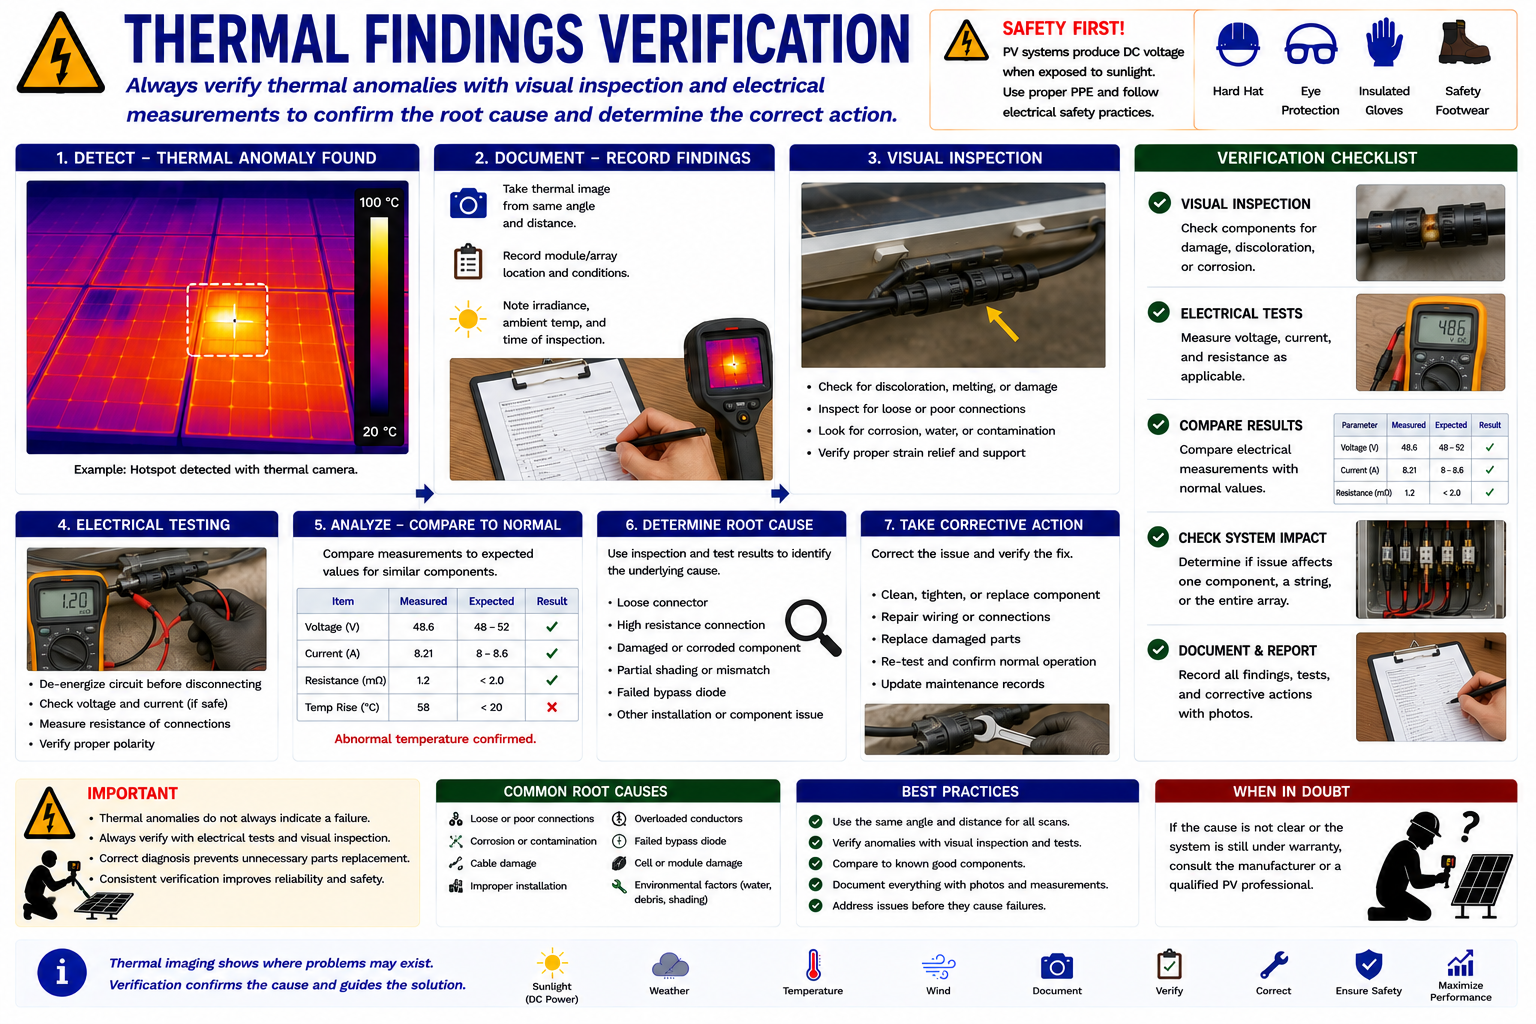
Turn the Thermal Finding Into a Diagnosis
Document the Thermal Pattern
Save the thermal image and, when useful, a corresponding visible-light photograph showing the physical location.
Confirm Operating Conditions
Record sunlight, shading, weather, approximate electrical loading, and other conditions that may influence the thermal image.
Perform Visual Inspection
Look for physical damage, contamination, loose components, discoloration, corrosion, damaged wiring, or other evidence associated with the thermal anomaly.
Review System Data
Use inverter, string, optimizer, microinverter, or monitoring information when available to determine whether electrical performance is also abnormal.
Test Electrically
When required, perform the appropriate voltage, current, resistance, insulation, or manufacturer-specified test using safe procedures and properly rated equipment.
Determine the Service Action
Use the combined evidence to decide whether the component is operating normally, requires further testing, needs repair, or should be replaced.
Never Diagnose From Color Alone
Thermal-camera color palettes are display tools. A bright yellow, red, or white area does not automatically mean that a component is defective, and a dark area does not automatically mean that it is operating normally.
Interpret the temperature pattern, scale, operating conditions, component type, comparison points, and supporting evidence.
Make the Thermal Image Useful Later
A thermal image without context can be difficult to interpret after the service visit. Record enough information to identify the component and reproduce the reasoning behind the finding.
Component Location
Identify the module, string, connector, disconnect, combiner position, breaker, or other component shown in the image.
Visible Photograph
A corresponding normal photograph can make the thermal target much easier to locate later.
Operating Conditions
Record relevant sunlight, weather, shading, load, and environmental conditions.
Temperature Information
Record useful apparent temperatures or temperature differences when they contribute to the diagnosis.
Verification Results
Document the visual, electrical, monitoring, or manufacturer diagnostic information used to verify the thermal finding.
Service Action
Record whether the condition required repair, replacement, additional monitoring, or no corrective action.
Thermal Imaging Can Help Verify the Result
When operating conditions permit a meaningful comparison, thermal imaging can be repeated after a repair to determine whether the abnormal temperature pattern has been eliminated.
Post-repair thermal inspection should be combined with appropriate electrical and operational verification. The objective is not merely to make the thermal image look different but to confirm that the PV system has returned to proper operation.
Non-Contact Does Not Mean No Hazard
A thermal camera allows observation without direct electrical contact, but the technician may still be working near energized PV conductors, utility voltage, electrical equipment, roof edges, damaged modules, or battery energy-storage equipment.
Do not allow the camera display to distract from the work environment. Maintain safe positioning and electrical clearances, use required PPE, follow applicable electrical safe-work procedures, and do not enter unsafe locations simply to obtain a thermal image.
What You Should Take From This Lesson
Thermal Imaging Is a Diagnostic Tool
It identifies temperature patterns and differences that can help direct the troubleshooting process.
Operating Conditions Matter
Sunlight, electrical load, clouds, wind, shading, and recent operating conditions can influence thermal patterns.
Hotspots Require Investigation
A localized hot cell or module area may indicate an abnormal condition, but the cause must be verified.
Connections Can Overheat
Abnormal resistance at connectors and terminations can produce localized heating while current is flowing.
Watch for Reflections
PV module glass and other reflective surfaces can create misleading apparent temperatures. Changing the viewing angle can help identify reflections.
Verify Before Diagnosing
Combine thermal findings with visual inspection, monitoring data, electrical measurements, and manufacturer information before making a service decision.
Visual Inspection and Assessment
You should now be able to plan a systematic PV inspection, document the installed system, inspect modules and mounting systems, recognize visible wiring and equipment defects, and use thermal imaging to identify areas requiring further investigation.
Part III moves from visual assessment into electrical testing and troubleshooting. The inspection information collected in Part II provides the system map and evidence needed to choose meaningful electrical test points.
Continue to Part III — Electrical Testing and Troubleshooting →
Visual Inspection and Assessment
Return to the Part II landing page for all four Visual Inspection and Assessment lessons.