Refrigerant Pressure-Temperature Relationships
Refrigerant pressure and saturation temperature are directly related. If the pressure of saturated refrigerant is known, its saturation temperature can be determined. If its saturation temperature is known, the corresponding saturation pressure can be determined.
This relationship is one of the most useful tools in refrigeration service. It allows a technician to convert pressure measurements into meaningful evaporating and condensing temperatures, calculate superheat and subcooling, and better understand what is happening inside the refrigeration system.
What You Will Learn
By the end of this lesson you should be able to:
Explain the P-T relationship.
Describe how saturation pressure and saturation temperature are related.
Read a P-T chart.
Convert measured refrigerant pressure into saturation temperature and temperature into expected saturation pressure.
Identify where the P-T relationship applies.
Recognize that the saturation P-T relationship describes refrigerant at saturation rather than every refrigerant condition in the system.
Recognize superheated and subcooled conditions.
Explain why pressure and temperature must both be measured when refrigerant is outside the saturated region.
Define bubble point and dew point.
Understand how zeotropic refrigerant blends change state over a temperature range.
Apply temperature glide correctly.
Use the appropriate bubble or dew value when working with superheat and subcooling.
Saturation Pressure and Temperature Move Together
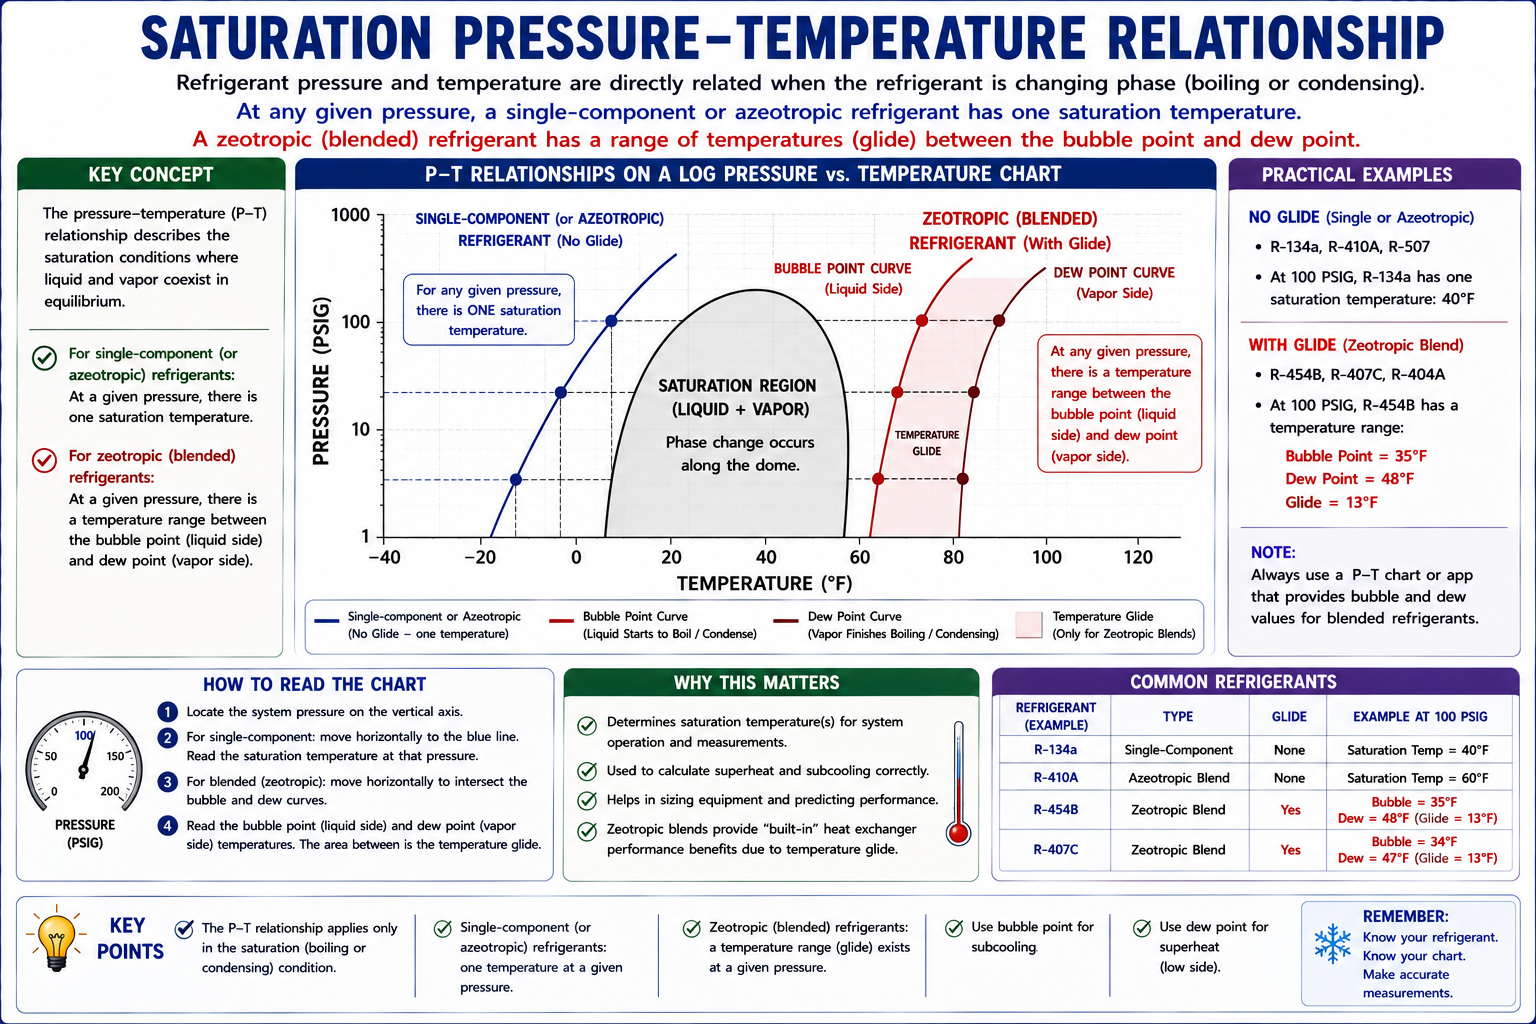
Every refrigerant has its own pressure-temperature characteristics. As refrigerant saturation pressure increases, its saturation temperature also increases. As saturation pressure decreases, saturation temperature decreases.
Lower Saturation Temperature
Useful in the evaporator, where refrigerant must boil at a temperature below the material being cooled.
Higher Saturation Temperature
Useful in the condenser, where refrigerant must condense above the temperature of the cooling medium.
A pressure that corresponds to a particular saturation temperature for one refrigerant will normally correspond to a different temperature for another refrigerant. Always use P-T information for the refrigerant actually in the system.
The P-T Relationship Describes Saturation Conditions
The pressure-temperature relationship is especially useful when refrigerant is at saturation, meaning that a phase change is occurring or the refrigerant is at the boundary between liquid and vapor.
Liquid refrigerant is at the point where additional heat will begin producing vapor.
Both phases exist while boiling or condensation is taking place.
Vapor is at the point where the last liquid has just completed vaporization.
When saturated refrigerant pressure is known, the correct P-T data allows that pressure to be expressed as a saturation temperature.
Pressure Can Be Converted Into Saturation Temperature
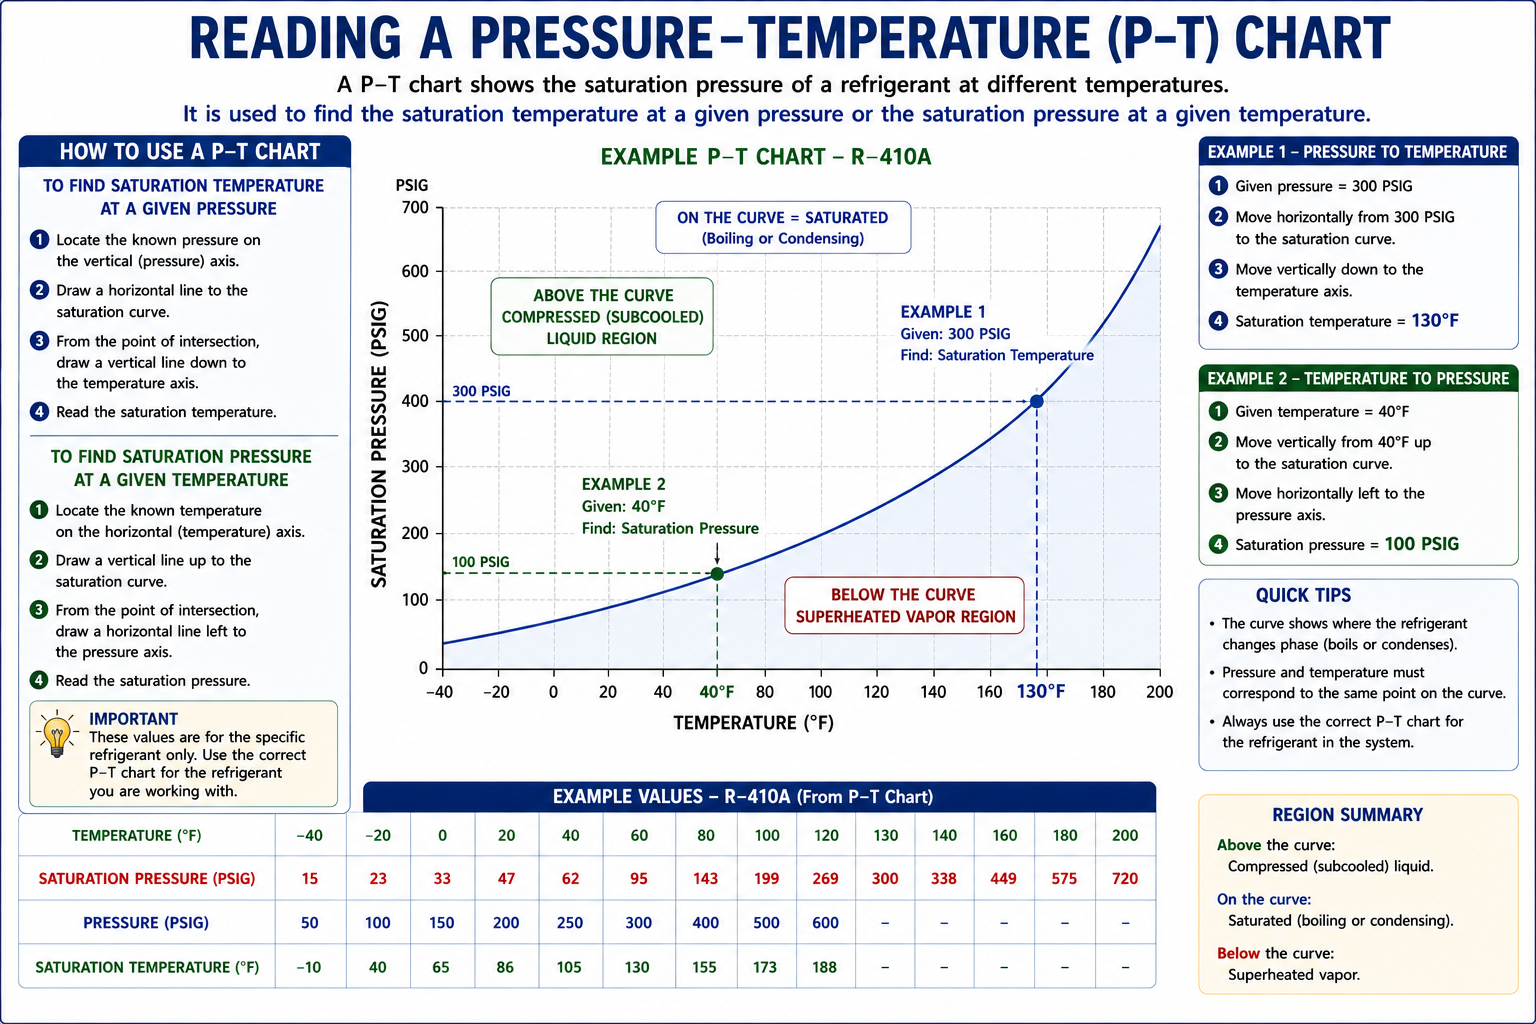
Pressure → Temperature
Locate the measured pressure on the chart and read across to the corresponding saturation temperature.
Temperature → Pressure
Locate the saturation temperature and read the corresponding expected saturation pressure.
Verify that the chart uses the same pressure units as your instrument. In U.S. HVAC/R service work, P-T charts commonly use PSIG, but this should never be assumed.
Using Suction Pressure to Determine Evaporating Temperature
Suppose a technician measures suction pressure on a running system. The pressure measurement by itself does not tell the technician whether the evaporator is operating at 20°F, 40°F, or 60°F.
The refrigerant P-T chart converts that pressure into the corresponding saturation temperature.
Measure Pressure
Read suction pressure at an appropriate service location.
Use Correct P-T Data
Find that pressure for the refrigerant in the system.
Determine Saturation Temperature
This represents the refrigerant’s evaporating saturation condition.
The saturation temperature corresponding to low-side pressure is commonly called evaporating temperature, evaporator saturation temperature, or SST depending on the equipment and reference material.
High-Side Pressure Can Be Converted the Same Way
High-side pressure can be converted into the refrigerant’s condensing saturation temperature using the same principle.
Measure High-Side Pressure
Read the refrigerant pressure on the high side of the system.
Use Correct P-T Data
Locate the measured pressure for the refrigerant being serviced.
Determine Condensing Temperature
The P-T value represents the corresponding high-side saturation temperature.
Comparing evaporating and condensing saturation temperatures with indoor and outdoor conditions tells the technician much more than simply labeling pressures as “high” or “low.”
Not Every Refrigerant Temperature Must Match the P-T Chart
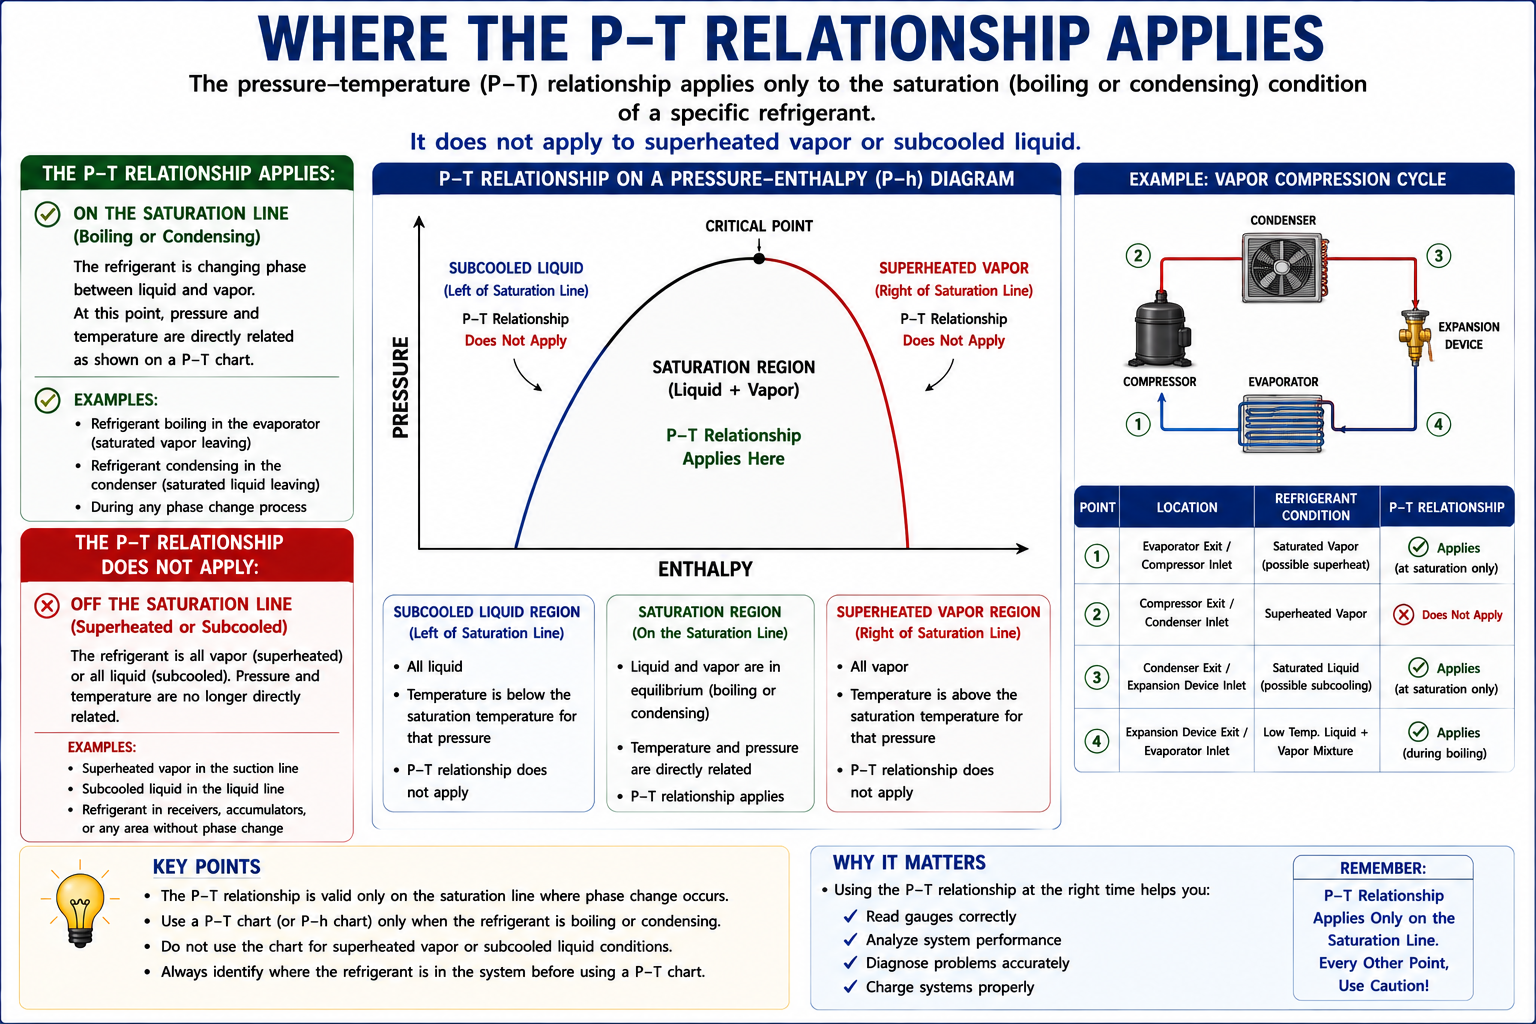
This distinction is critical. A technician should not expect every measured refrigerant-line temperature to equal the saturation temperature from a P-T chart.
Below Saturation Temperature
Liquid refrigerant can be cooled below its saturation temperature while remaining liquid.
Phase Change Region
Pressure and saturation temperature are directly related while liquid and vapor coexist.
Above Saturation Temperature
Vapor can be heated above saturation temperature while remaining vapor.
The difference between actual line temperature and saturation temperature tells us how far refrigerant has moved away from the saturated condition.
Do Not Compare Suction-Line Temperature Directly to a P-T Chart
Suppose a suction-line temperature is measured at 55°F. Looking up 55°F on a P-T chart does not tell you what suction pressure should be unless the refrigerant at that exact point is saturated.
Measured Suction-Line Temperature
Automatic Saturation Temperature
The suction vapor may already be superheated.
Pressure provides saturation temperature. Actual suction-line temperature is then compared with that saturation temperature to determine superheat.
Some Refrigerants Change State Across a Temperature Range
The simple P-T relationship is easiest to understand with a pure refrigerant or an azeotropic refrigerant that changes phase at essentially one temperature for a given pressure.
Zeotropic refrigerant blends behave differently. Their individual components have different boiling characteristics, so the blend can evaporate or condense across a range of temperatures at essentially the same pressure.
Essentially One Saturation Temperature
Phase change occurs at essentially one temperature for a given saturation pressure.
Temperature Glide
Phase change occurs across a range between bubble point and dew point.
Bubble Point, Dew Point, and the Temperature Between Them
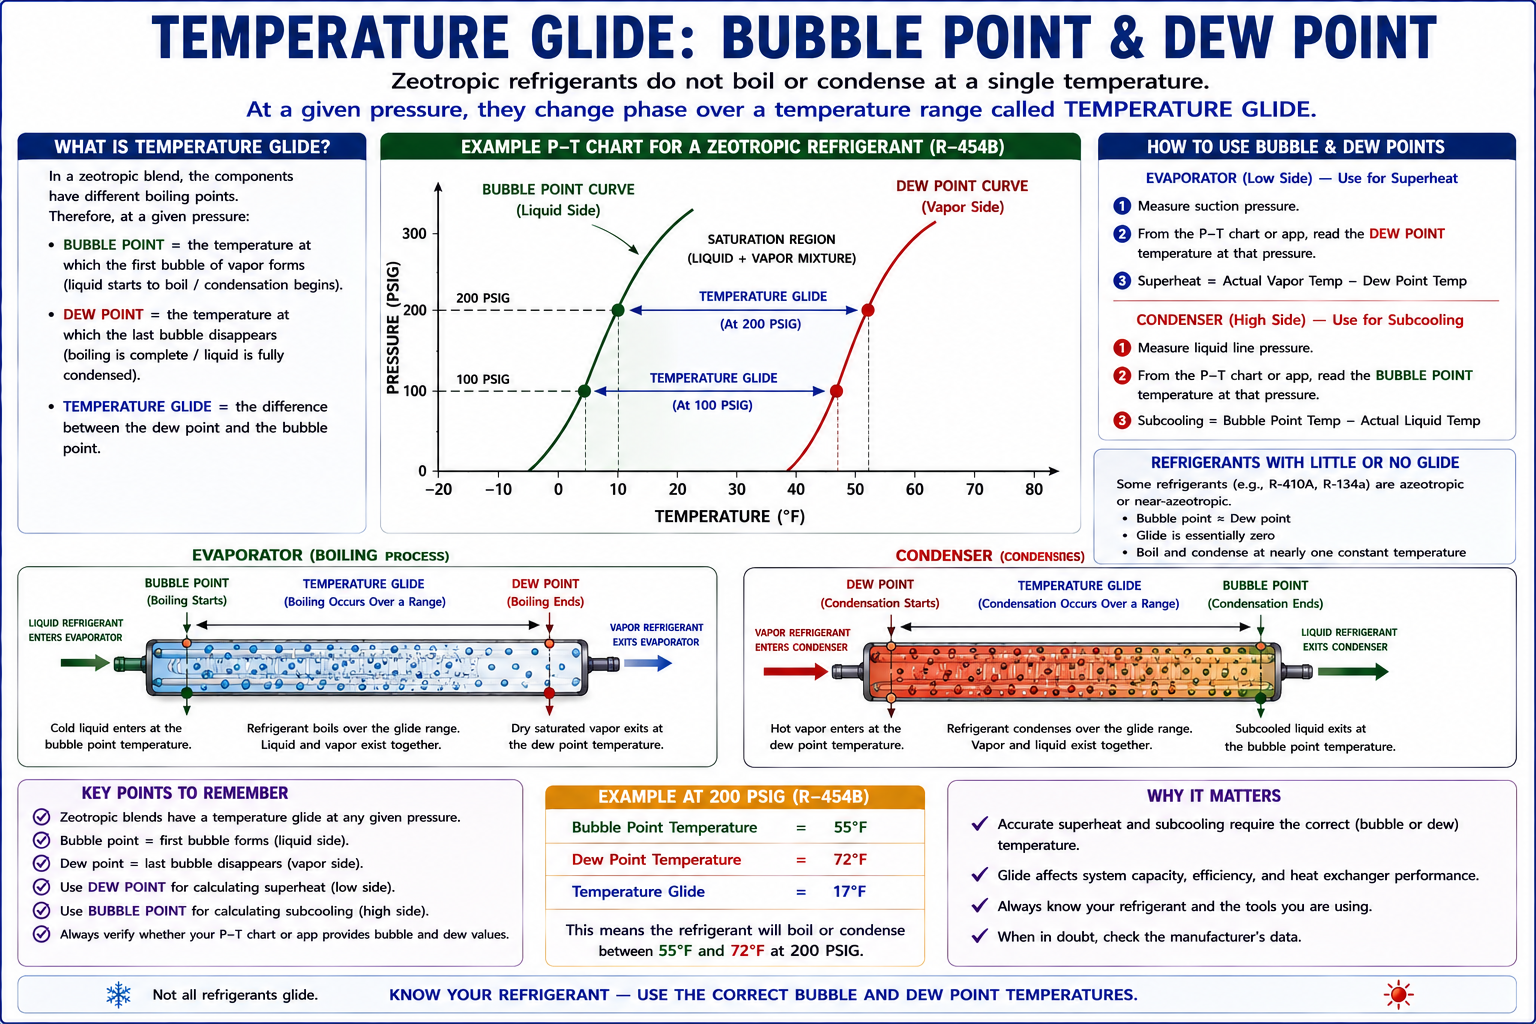
Liquid-Side Saturation Temperature
Bubble point is associated with the saturated-liquid side of the phase change, where the first bubble of vapor begins to form during heating.
Vapor-Side Saturation Temperature
Dew point is associated with the saturated-vapor side, where the final liquid has completed vaporization during evaporation.
The difference between the two saturation temperatures represents the glide of the blend at that pressure.
Use Dew Point for Superheat
Superheat is measured on the vapor side of the refrigeration process. For a zeotropic blend with separate bubble and dew values, the vapor-side saturation reference is the dew point.
When the refrigerant manufacturer or service data provides separate bubble and dew saturation values, use the dew-point value for superheat calculations unless the equipment documentation specifically directs otherwise.
Use Bubble Point for Subcooling
Subcooling is measured on the liquid side of the refrigeration process. For a zeotropic blend with separate bubble and dew values, the liquid-side saturation reference is the bubble point.
When separate values are provided, use bubble-point saturation temperature as the liquid reference for subcooling unless manufacturer-specific instructions state otherwise.
Ignoring Glide Can Produce Incorrect Calculations
Superheat
Using bubble temperature instead of dew temperature can produce an incorrect superheat value.
Subcooling
Using dew temperature instead of bubble temperature can produce an incorrect subcooling value.
Coil Temperature
A zeotropic blend can enter and leave the phase-change portion of a coil at different saturation temperatures.
Diagnosis
A technician must know whether the service app or chart is showing bubble, dew, or both.
Not Every Blend Has a Large Temperature Glide
Some refrigerant blends have very small temperature glide. In practical service work, their bubble and dew values may be very close together.
Other blends have enough glide that the distinction between bubble and dew becomes important to accurate calculations.
Use current refrigerant data, a trusted P-T chart, manufacturer documentation, or a verified service application to determine whether separate bubble and dew values apply.
P-T Charts Are Often Built Into Modern Instruments
Modern digital manifolds, probes, manufacturer applications, and service software can automatically convert pressure to saturation temperature.
Printed P-T Chart
Useful for understanding the relationship and as a simple field reference.
Digital Manifold
Can display saturation temperature directly after the correct refrigerant is selected.
Service Application
Can provide refrigerant-specific pressure, temperature, bubble, and dew data.
Manufacturer Documentation
Remains the final reference for equipment-specific charging and diagnostic procedures.
A digital manifold may perform the conversion automatically, but the technician still needs to understand what saturation temperature means and whether the displayed value represents bubble point, dew point, or a single saturation value.
Pressure Becomes More Meaningful When Expressed as Temperature
Evaporator
Compare evaporating saturation temperature with return-air or product temperature to understand the evaporator’s temperature difference.
Condenser
Compare condensing saturation temperature with outdoor air or condenser-water temperature.
Superheat
Compare actual vapor temperature with the appropriate vapor-side saturation temperature.
Subcooling
Compare liquid saturation temperature with actual liquid-line temperature.
System pressure changes with refrigerant type, indoor load, outdoor conditions, airflow, equipment design, and operating mode. Converting pressure into saturation temperature helps place the measurement into its proper physical context.
Avoid These P-T Errors
“Every refrigerant has the same P-T relationship.”
Each refrigerant has its own pressure-temperature characteristics.
“Every measured refrigerant temperature should match the P-T chart.”
The P-T relationship identifies saturation temperature. Superheated vapor and subcooled liquid will differ from saturation temperature.
“Every blend has one saturation temperature.”
Zeotropic blends can have separate bubble and dew temperatures at the same pressure.
“Bubble point is used for superheat.”
For a zeotropic blend with separate values, dew point is the vapor-side reference used for superheat.
“Dew point is used for subcooling.”
For a zeotropic blend with separate values, bubble point is the liquid-side reference used for subcooling.
“If pressure looks normal, the system must be operating correctly.”
Pressure must be interpreted with temperature, airflow, load, refrigerant type, and other system conditions.
Can You Use the P-T Relationship Correctly?
- What happens to saturation temperature as refrigerant pressure increases?
- Why must a P-T chart match the refrigerant in the system?
- What does a P-T chart convert measured pressure into?
- Can a P-T chart be read from temperature to pressure as well as pressure to temperature?
- What does low-side saturation temperature represent?
- What does high-side saturation temperature represent?
- Why does actual suction-line temperature usually not equal saturation temperature?
- What is superheated vapor?
- What is subcooled liquid?
- What is temperature glide?
- What is bubble point?
- What is dew point?
- Which saturation reference is normally used for superheat on a zeotropic blend?
- Which saturation reference is normally used for subcooling on a zeotropic blend?
- Why must a technician know whether a digital tool displays bubble point, dew point, or both?
- Why is saturation temperature usually more useful diagnostically than simply calling pressure “high” or “low”?
What You Should Have Learned
Each refrigerant has its own relationship between saturation pressure and saturation temperature.
A P-T chart can convert refrigerant pressure to saturation temperature or saturation temperature to pressure.
The saturation P-T relationship applies to saturation conditions rather than every measured refrigerant temperature.
Superheated vapor exists above its saturation temperature, while subcooled liquid exists below its saturation temperature.
Zeotropic refrigerant blends may change phase across a temperature range called temperature glide.
Bubble point represents the liquid-side saturation condition and dew point represents the vapor-side saturation condition.
Dew-point saturation temperature is normally used for superheat calculations on a zeotropic blend with separate bubble and dew values.
Bubble-point saturation temperature is normally used for subcooling calculations on a zeotropic blend with separate bubble and dew values.
Digital tools can perform P-T conversions automatically, but the technician must understand what the displayed value represents.
Pressure becomes much more useful diagnostically when it is converted into saturation temperature and compared with actual system temperatures.