Psychrometrics in HVAC/R Service and Troubleshooting
Psychrometrics helps technicians turn temperature and moisture measurements into evidence about comfort, ventilation, cooling, heating, humidification, dehumidification, and air mixing.
This final lesson brings the section together with practical measurement locations, return-to-supply comparisons, troubleshooting patterns, and a repeatable field workflow. A chart pattern helps select the next check; it does not identify a failed component by itself.
What You Will Learn
Explain why temperature and relative humidity alone do not determine thermal comfort.
Select measurement locations that represent the intended HVAC airstreams.
Compare return, mixed, leaving-coil, and supply-air conditions correctly.
Recognize common cooling and dehumidification patterns on the chart.
Use psychrometric results to choose additional field checks without jumping to a diagnosis.
Apply the complete measure, plot, read, compare, calculate, and verify workflow.
Comfort Is More Than a Thermostat Setting
A psychrometric chart can show temperature-and-moisture targets, but it does not show every factor that affects thermal comfort. Air temperature, radiant temperature, humidity, and air speed interact with occupant activity and clothing.
The practical target area in the figure is an instructional illustration, not an ASHRAE Standard 55 compliance chart. Formal comfort evaluation must use the applicable standard, building type, operating conditions, and required calculation method.
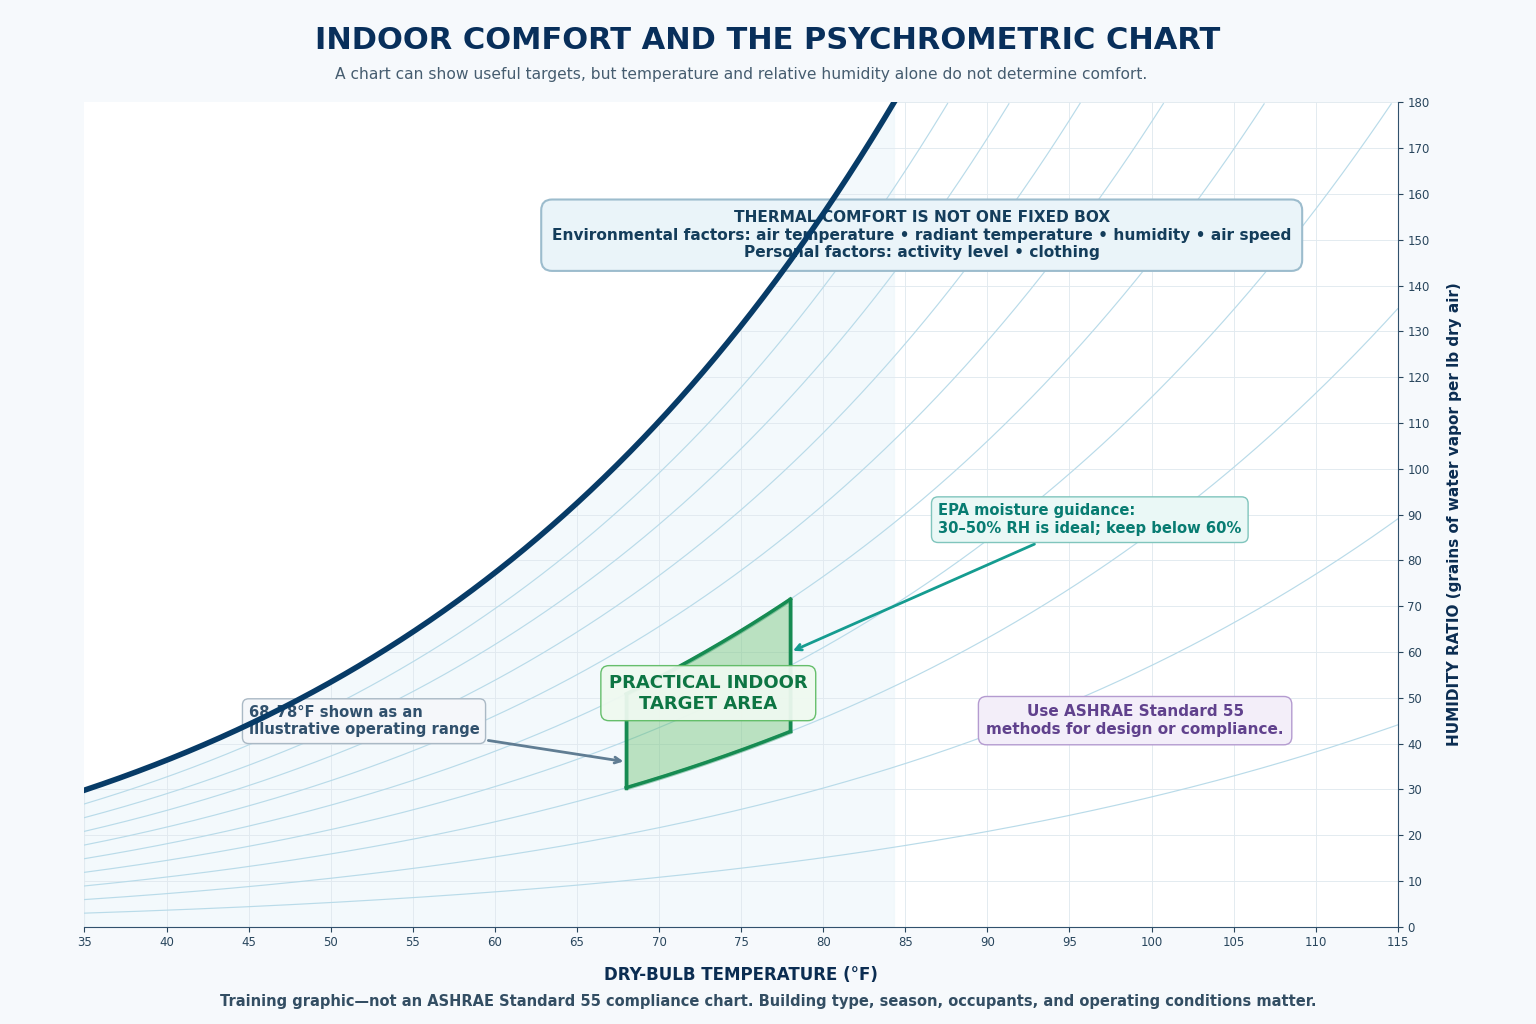
EPA moisture-control guidance recommends keeping indoor relative humidity below 60%, ideally between 30% and 50% when possible. This guidance helps reduce moisture problems, but comfort, building durability, climate, condensation risk, and the applicable design requirements must also be considered.
Ask What the Occupant Is Experiencing
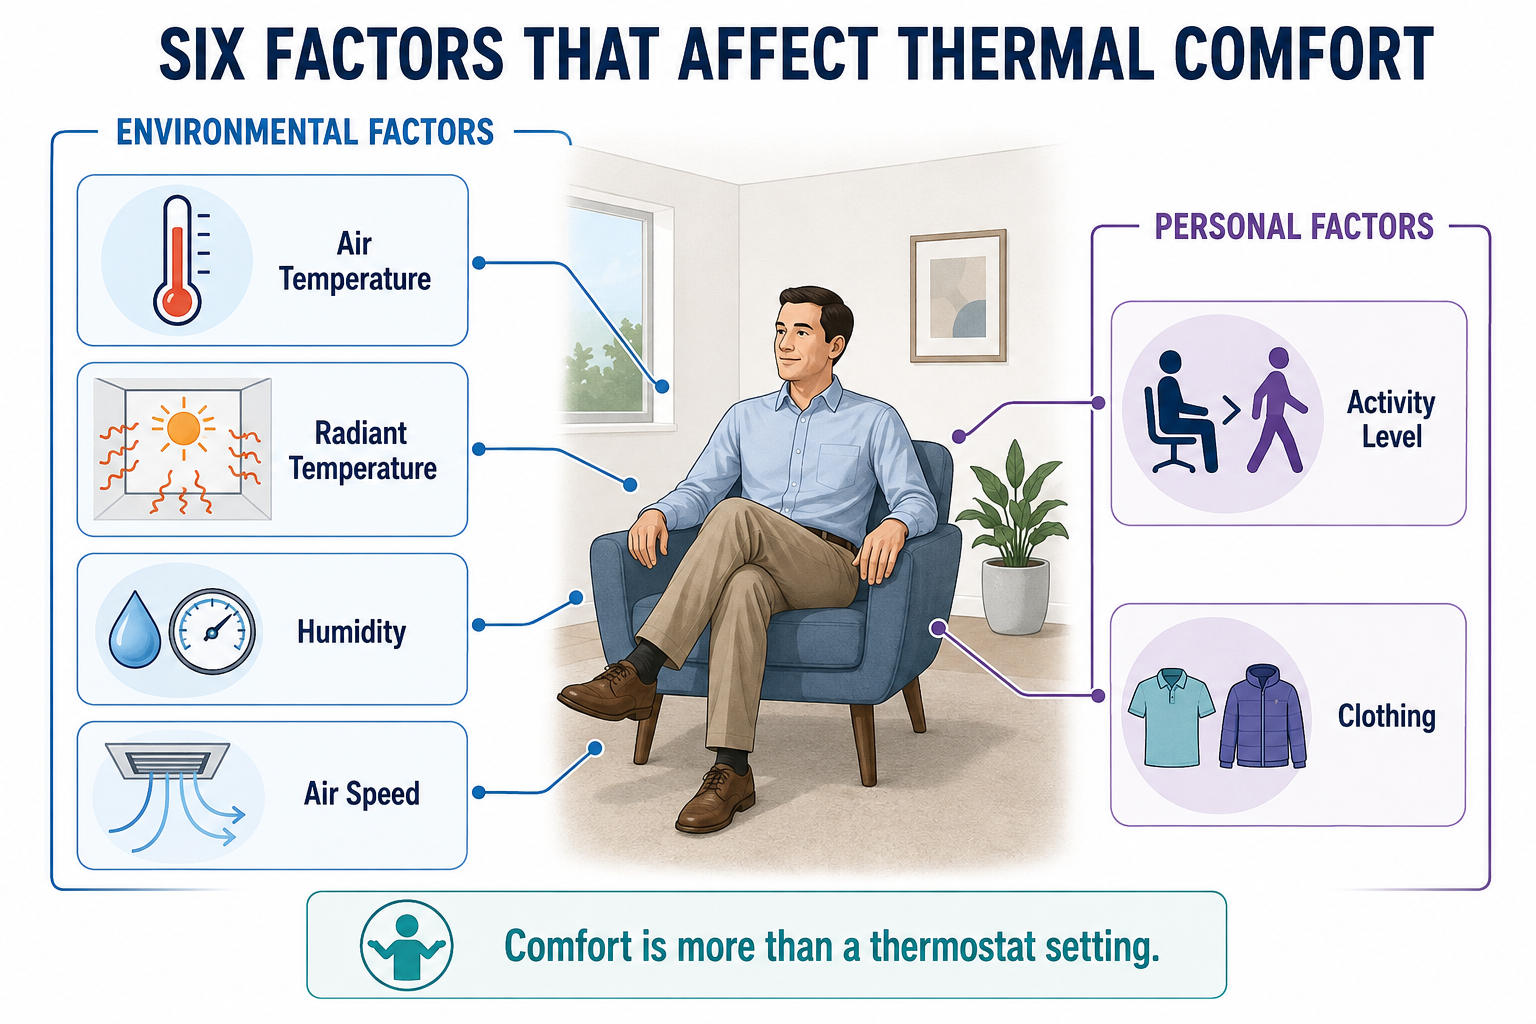
Air Temperature
The dry-bulb temperature measured near the occupant may differ from the thermostat reading.
Radiant Temperature
Hot roofs, cold windows, exterior walls, and other surfaces exchange radiant heat with occupants.
Humidity
Humidity influences evaporation, moisture perception, condensation risk, and building moisture conditions.
Air Speed
Moving air can increase cooling sensation, while drafts may create local discomfort.
Activity Level
A person doing physical work produces more metabolic heat than a seated occupant.
Clothing
Clothing insulation changes how readily an occupant exchanges heat with the surroundings.
Record the complaint’s location, time, weather, occupancy, activity, clothing, equipment operation, thermostat condition, air movement, and nearby surface conditions before deciding which measurements are useful.
Name the Airstream Before Taking the Reading
Return air, outdoor air, mixed air, leaving-coil air, and supply air are not interchangeable. Each measurement must represent a known airstream at a location before or after the process being evaluated.
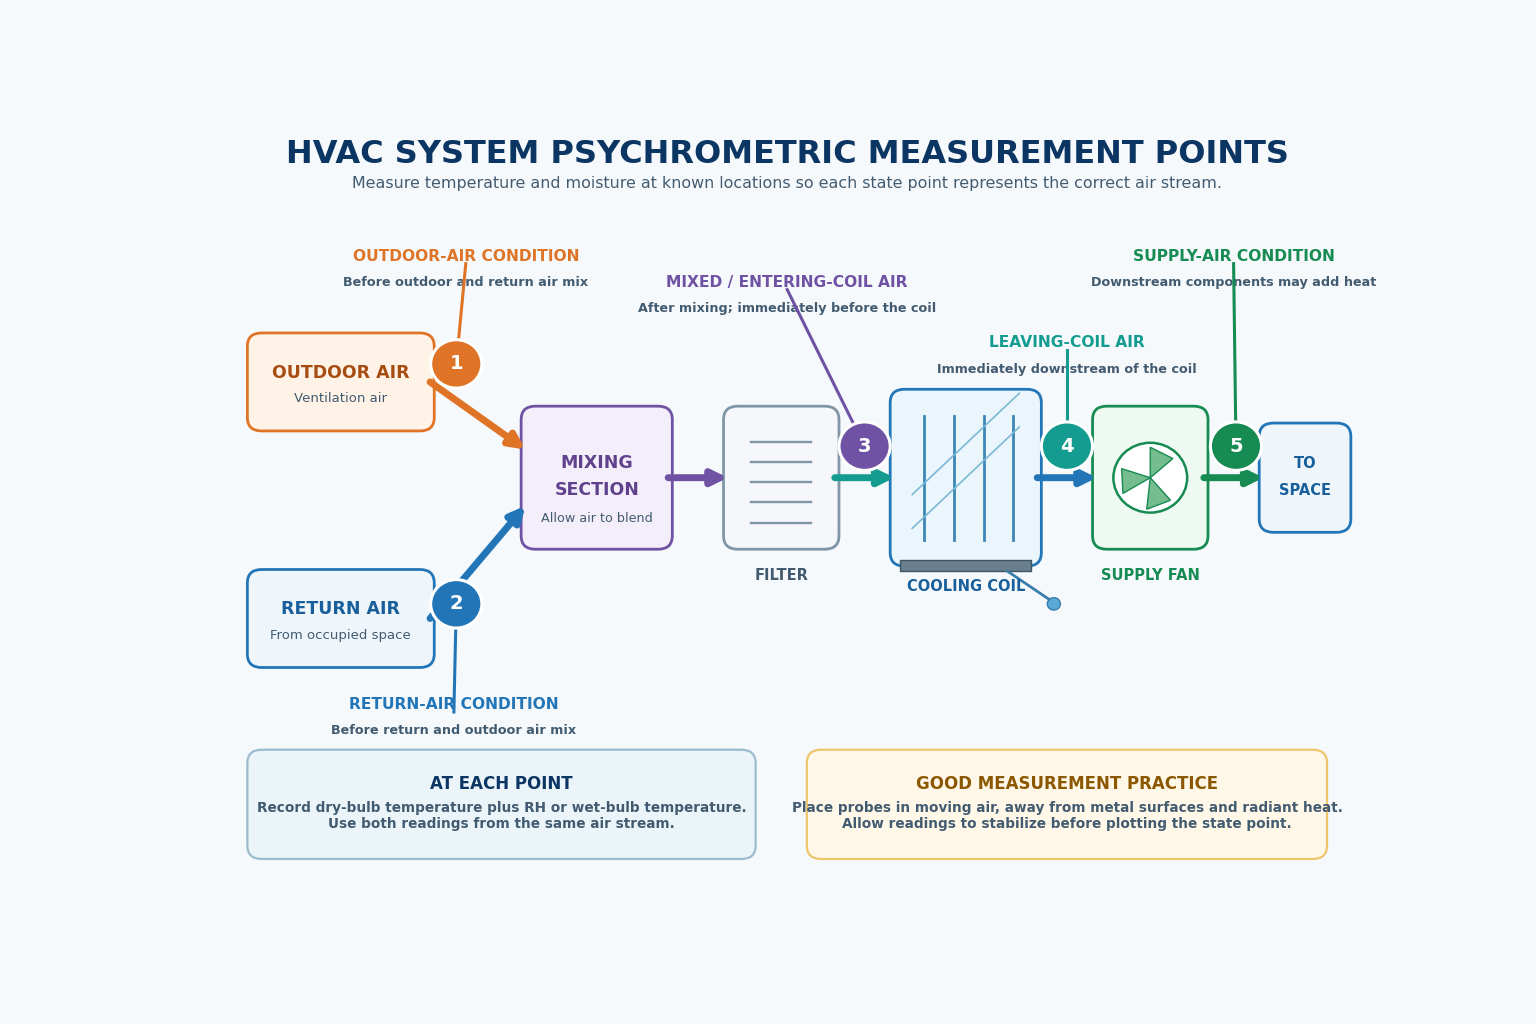
Outdoor Air
Measure before outdoor and return air mix and away from sun, rain, exhaust, condenser discharge, and heated surfaces.
Return Air
Measure the recirculated airstream before outdoor air or another stream enters.
Mixed or Entering-Coil Air
Measure after mixing and immediately before the coil where the air is sufficiently blended.
Leaving-Coil Air
Measure immediately downstream of the coil before the fan, reheat, duct gain, leakage, or another process changes it.
Supply Air
Measure at the intended supply location and recognize that fan heat, duct heat gain, leakage, and reheat may separate it from leaving-coil air.
Occupied Space
Measure where the complaint occurs rather than assuming one thermostat represents the entire space.
A return-air reading and a supply-air reading can describe the overall system effect, but they do not isolate the cooling coil when outdoor-air mixing, fan heat, reheat, duct gain, or leakage occurs between the two points.
Allow the Instruments and System to Stabilize
Place temperature and moisture probes in moving air away from metal surfaces, direct radiant heat, water droplets, and locations with poor mixing. Keep paired sensors together in the same representative airstream and allow both readings to stabilize.
Confirm Operating Mode
Record cooling, heating, dehumidification, humidification, economizer, ventilation, staging, fan, and reheat operation.
Check the Instruments
Inspect sensors, follow calibration or accuracy checks, and avoid using a damaged wet-bulb wick or contaminated humidity sensor.
Wait for Stable Readings
Watch the values long enough to determine whether they are stable, drifting, or cycling with equipment operation.
Record Context
Document time, location, outdoor condition, airflow, damper position, load, equipment stage, and anything that could alter the airstream.
Psychrometric properties change with barometric pressure. Use a chart or software appropriate for the site’s pressure or elevation, especially when calculations depend on specific volume, enthalpy, or humidity ratio.
Compare Temperature and Moisture Together
In the example, air changes from 75°F dry bulb and 55% relative humidity to 55°F dry bulb and 95% relative humidity. The supply air has the higher relative humidity percentage, but its humidity ratio is lower—approximately 61 grains/lb dry air compared with 71 grains/lb dry air in the return.
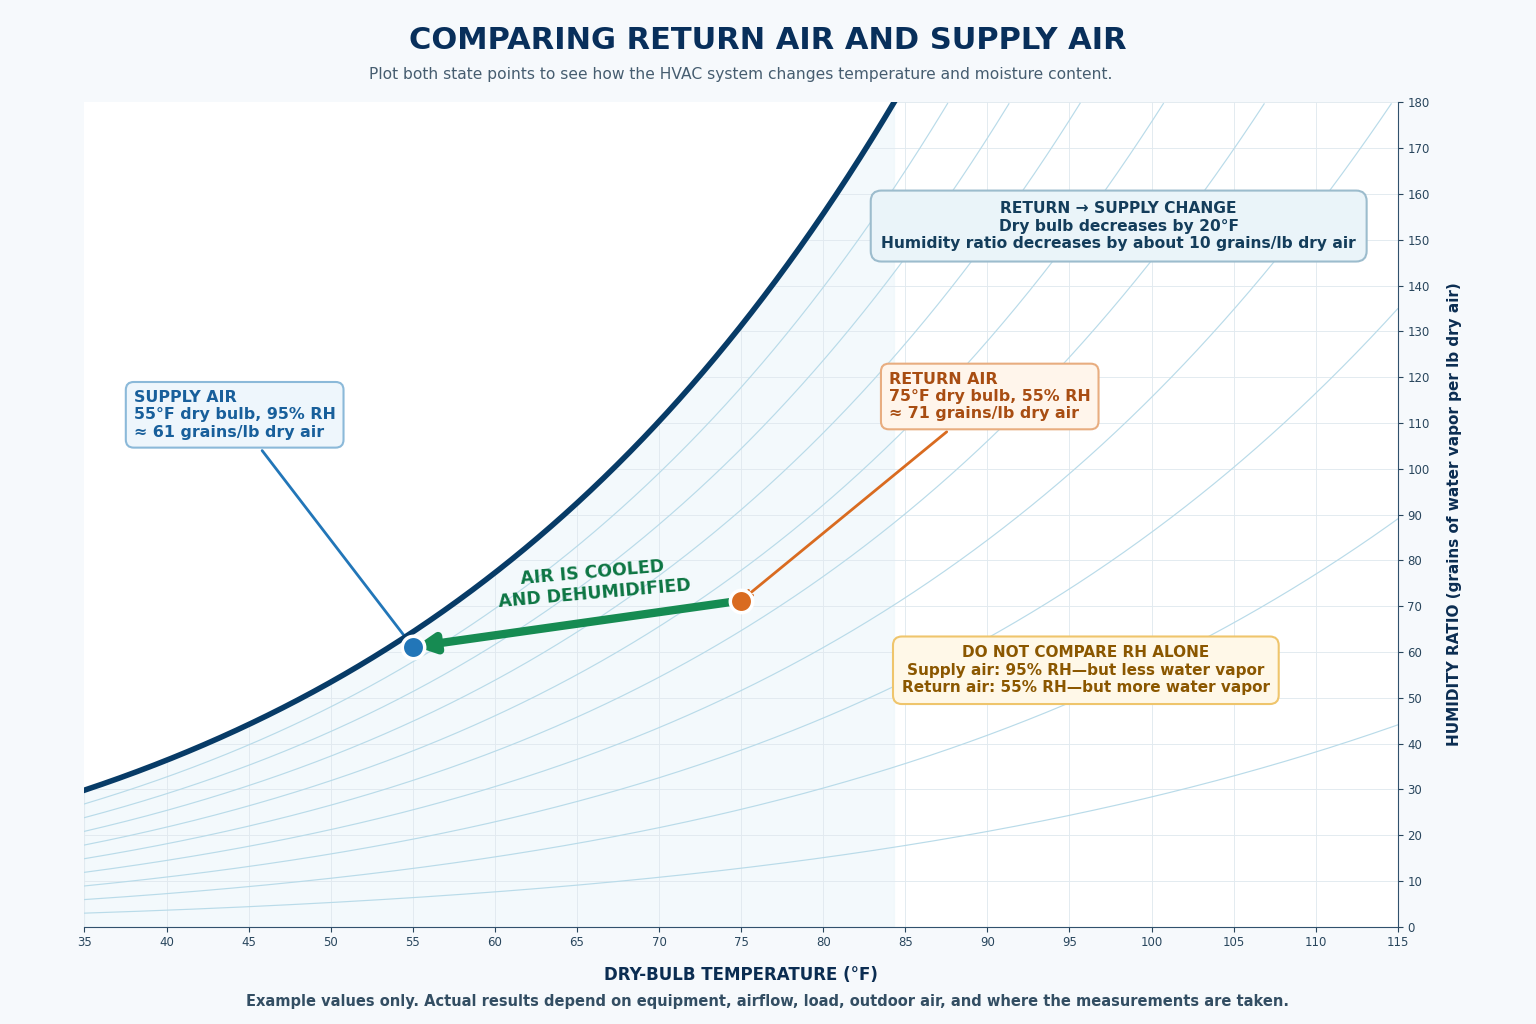
Relative humidity rises as air approaches saturation during cooling. Compare humidity ratio or dew point to determine whether the airstream gained or lost water vapor.
Example limitation: Actual return-to-supply changes depend on equipment, airflow, load, outdoor-air percentage, controls, fan heat, duct conditions, and measurement locations. Do not use the example values as universal targets.
Let the Pattern Choose the Next Checks
Plotting two related state points shows the direction and size of the air process. Compare that pattern with the expected equipment sequence, then select additional measurements that can confirm or reject possible causes.
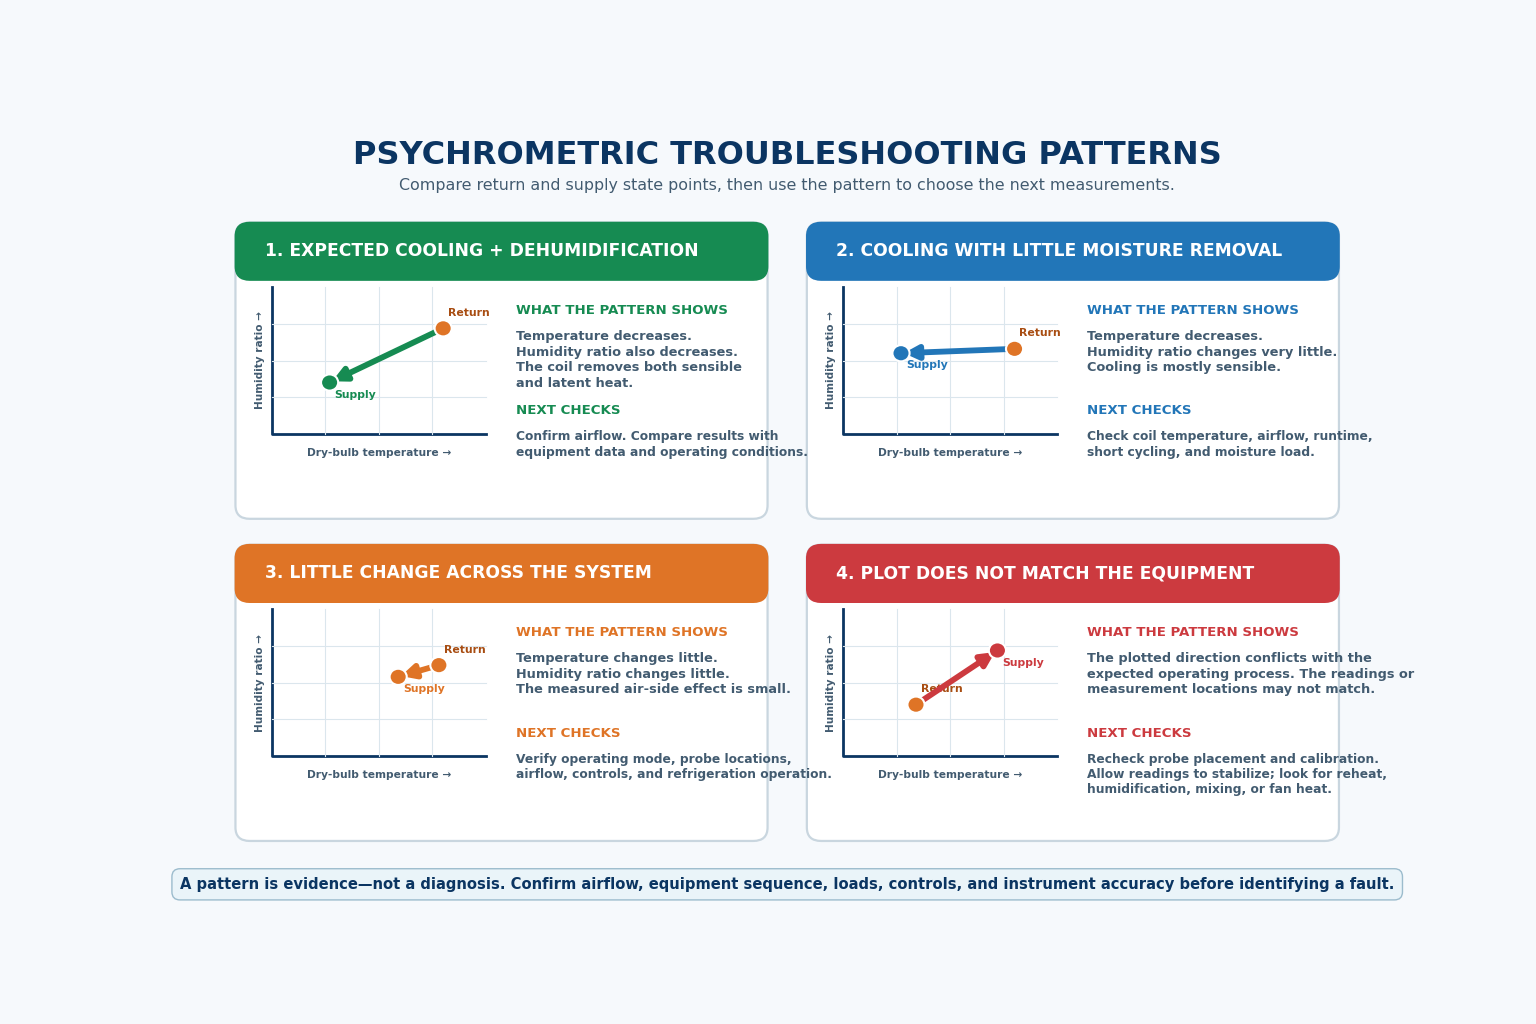
Cooling and Dehumidification
Dry-bulb temperature and humidity ratio both decrease. Confirm airflow and compare the measured change with equipment data and operating conditions.
Cooling with Little Moisture Removal
Temperature decreases while humidity ratio changes little. Check coil temperature, airflow, runtime, short cycling, controls, and moisture load.
Little Change Across the System
Temperature and humidity ratio change little. Verify operating mode, probe locations, airflow, controls, and refrigeration or heating operation.
Process Does Not Match the Equipment
Recheck air streams, probe placement, instrument accuracy, stabilization, mixing, fan heat, humidification, dehumidification, reheat, and equipment sequence.
Airflow, load, coil condition, refrigerant operation, outdoor air, controls, cycling, sensor error, leakage, bypass, and measurement location can affect the plotted process. Verify with direct equipment tests before identifying a fault.
Use the Same Six Steps Every Time
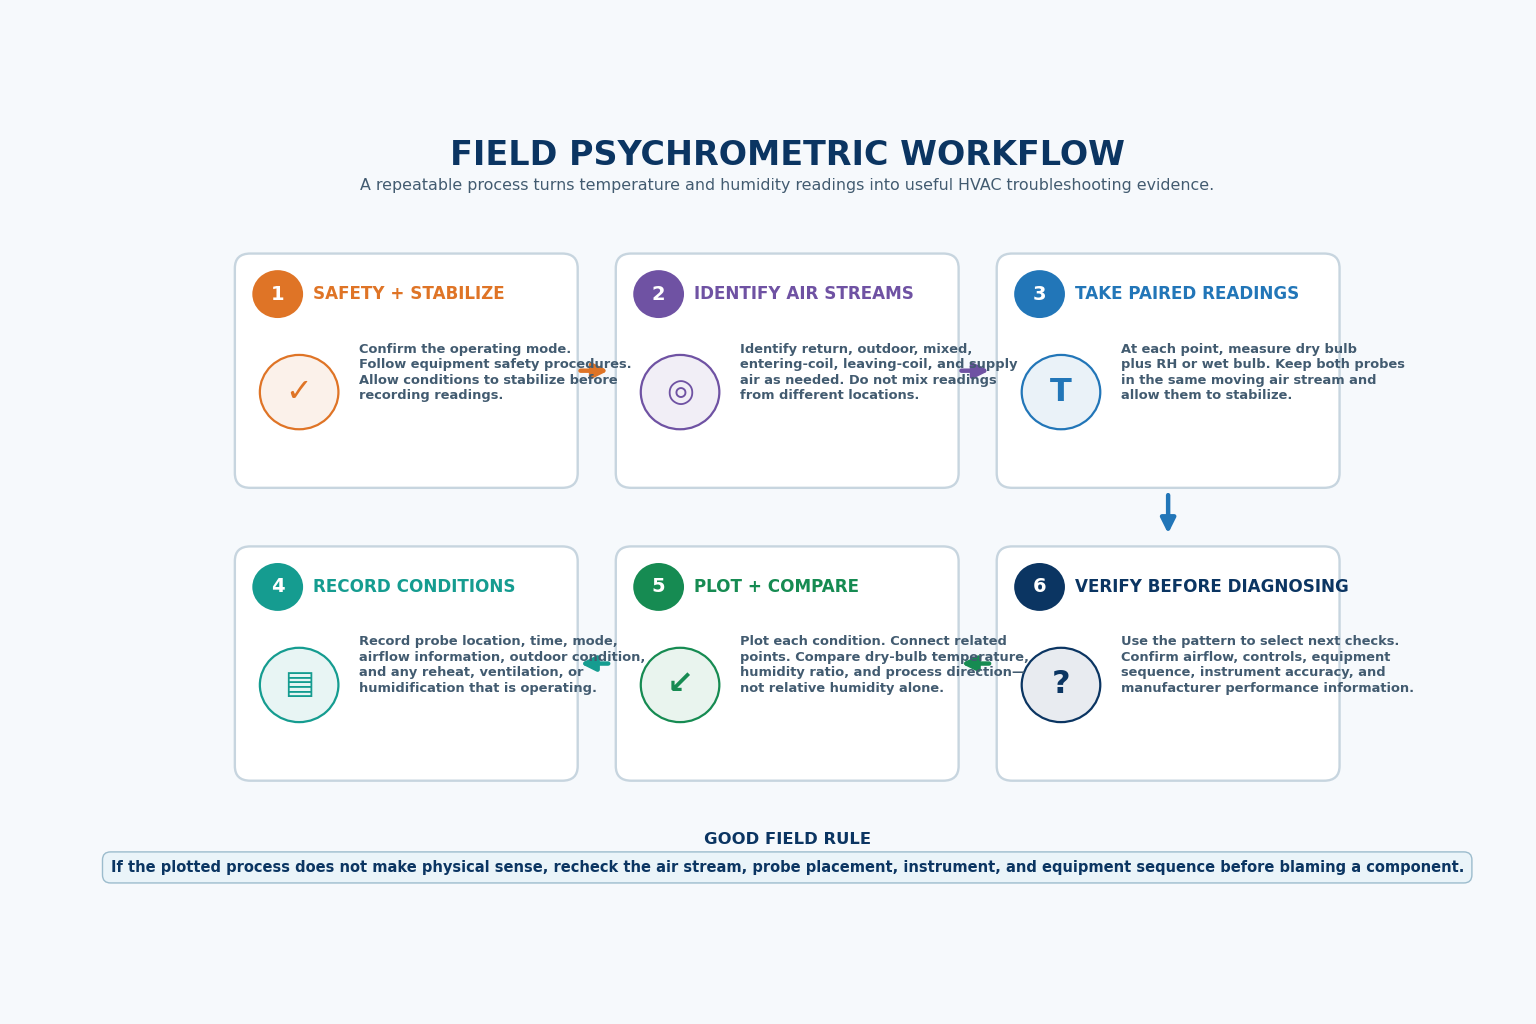
1. Safety and Stabilize
Follow equipment safety procedures, confirm operating mode, and allow conditions to become representative.
2. Identify Air Streams
Name each measurement point and determine what mixing or equipment process occurs between the points.
3. Take Paired Readings
Measure dry bulb plus relative humidity or wet bulb in the same moving airstream and allow both to stabilize.
4. Record Conditions
Document locations, time, mode, airflow, outdoor condition, damper position, stage, fan, and active processes.
5. Plot and Compare
Plot each state, connect related points, and compare dry bulb, humidity ratio, dew point, enthalpy, and process direction.
6. Verify Before Diagnosing
Confirm airflow, controls, sequence, instrument accuracy, and manufacturer performance information with direct tests.
If the plotted process does not make physical sense, recheck the airstream, probe placement, instrument, chart pressure, stabilization, and equipment sequence before blaming a component.
Use Psychrometrics to Narrow the Investigation
Space Feels Clammy
Check indoor humidity ratio and dew point, runtime, cycling, airflow, coil condition, ventilation air, moisture sources, and whether sensible load is satisfied before latent load.
Condensation Appears
Compare the air dew point with the surface temperature, then investigate insulation, air leakage, vapor movement, humidity sources, and equipment operation.
Supply Air Seems Too Warm
Compare entering-coil, leaving-coil, and supply conditions to separate coil performance from fan heat, reheat, duct gain, leakage, and sensor location.
Humidity Does Not Decrease
Verify that the coil operates below the entering-air dew point and check airflow, runtime, short cycling, bypass, controls, reheat, outdoor air, and moisture load.
Mixed Air Is Unexpected
Plot outdoor, return, and mixed air; then check mixing, dampers, leakage, sensor location, airflow proportions, wind, pressure, and economizer sequence.
Capacity Estimate Is Low
Recheck airflow, state-point measurements, pressure basis, units, equipment stage, operating conditions, and manufacturer data before concluding that capacity is deficient.
Measure, Plot, Read, Compare, Calculate, and Verify
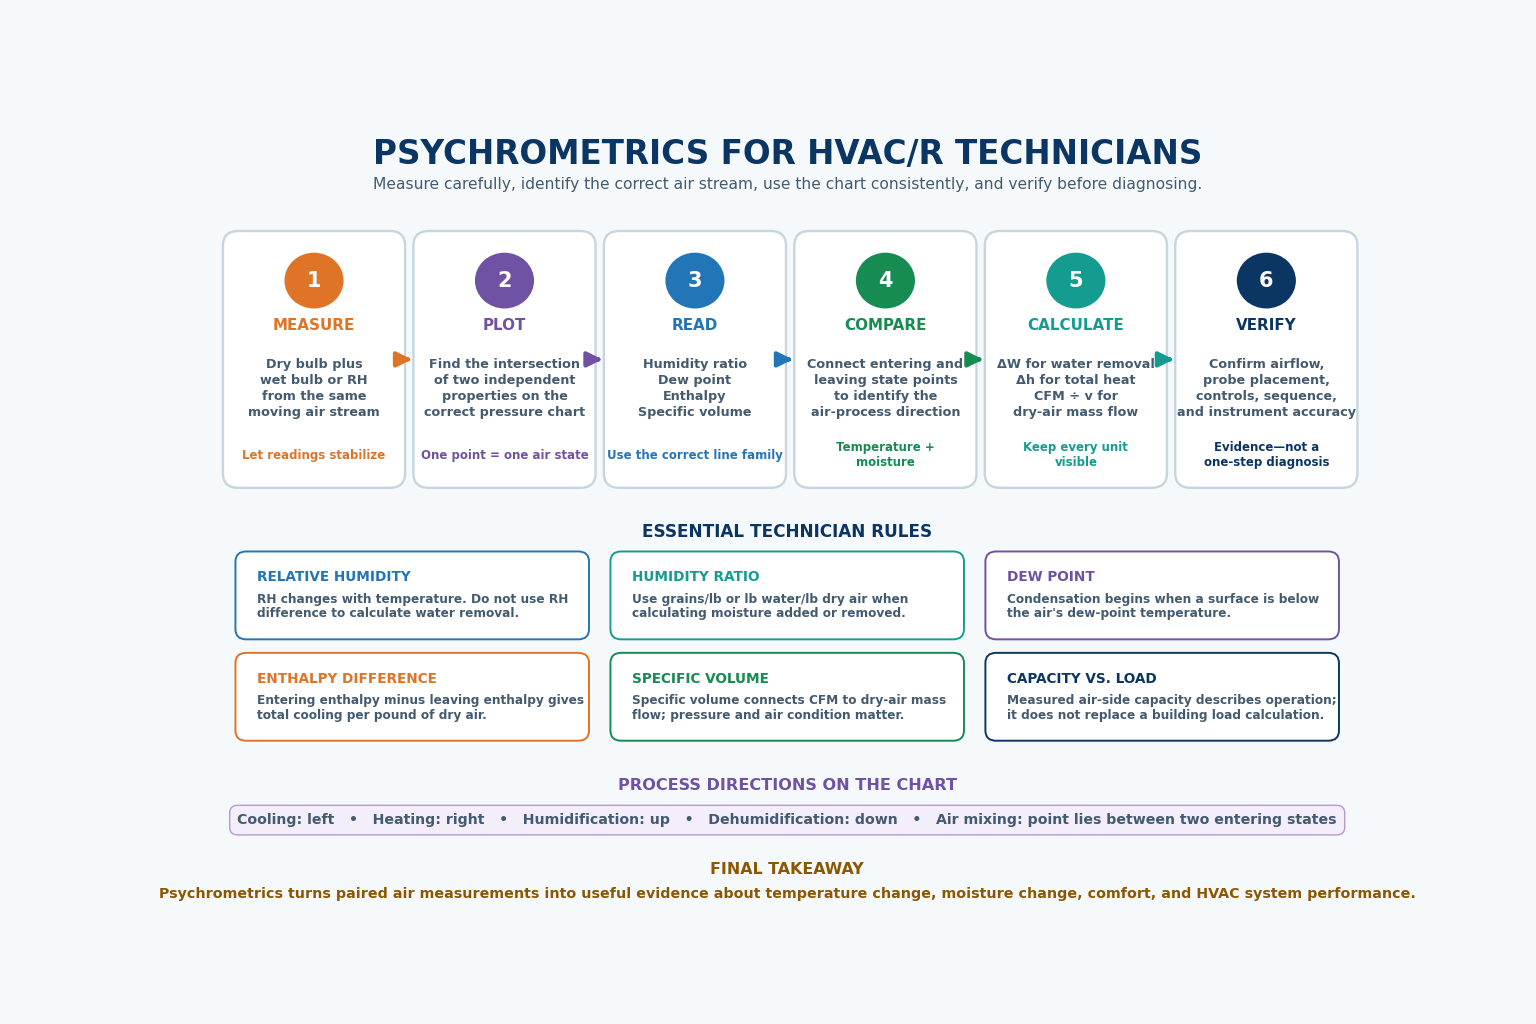
“Relative humidity measures water quantity directly.”
Relative humidity changes with temperature. Use humidity ratio when calculating water added or removed.
“A chart point proves what component failed.”
A point describes one air condition. A process pattern guides additional measurements and equipment checks.
“Supply air and leaving-coil air are always identical.”
Fan heat, reheat, duct gain, leakage, and other processes can change air after it leaves the coil.
“One comfort temperature works for everyone.”
Comfort depends on environmental and personal factors and varies among occupants.
“An air-side estimate is the building load.”
Measured capacity describes operation at the measured condition and does not replace a building load calculation.
“If the plot looks wrong, the equipment is bad.”
First verify the air streams, locations, instruments, stabilization, chart basis, controls, and equipment sequence.
Can You Apply Psychrometrics in the Field?
- What six environmental and personal factors affect thermal comfort?
- Why is an instructional comfort target not an ASHRAE Standard 55 compliance chart?
- Why must a technician name each airstream before taking measurements?
- What can cause supply air to differ from leaving-coil air?
- Why must paired temperature and moisture probes sample the same moving airstream?
- Why can cool supply air have a higher relative humidity but a lower humidity ratio than return air?
- What pattern indicates cooling and dehumidification?
- What should be checked when dry-bulb temperature decreases but humidity ratio changes little?
- What should be checked when the plotted process conflicts with the expected equipment operation?
- Why is a psychrometric pattern evidence rather than a diagnosis?
- What are the six steps in the field workflow?
- Why must air-side capacity be compared with operating conditions and manufacturer data?
What You Should Have Learned
Thermal comfort depends on air temperature, radiant temperature, humidity, air speed, activity, and clothing.
Useful psychrometric diagnosis requires representative paired measurements from correctly identified airstreams.
Return, mixed, entering-coil, leaving-coil, supply, and space conditions describe different locations and processes.
Relative humidity alone can mislead; compare humidity ratio or dew point when evaluating moisture change.
The direction and size of a plotted process help determine which airflow, controls, refrigeration, heating, and moisture checks should follow.
A similar chart pattern can have several causes, so direct tests and manufacturer information are required before identifying a fault.
The repeatable field sequence is measure, plot, read, compare, calculate, and verify.
Psychrometrics is a practical technician tool for organizing air measurements and making the next diagnostic step more informed.