Introduction to the Pressure-Enthalpy Diagram
The pressure-enthalpy diagram provides another way to visualize the refrigeration cycle. Instead of looking at the compressor, condenser, metering device, and evaporator as separate components, the diagram shows how refrigerant pressure, energy content, state, superheat, and subcooling change as the refrigerant moves through the complete cycle.
Pressure-enthalpy diagrams can become very detailed, but a beginning technician does not need to master every line on the chart. The important first step is learning to recognize the major refrigerant regions and the four processes that form the vapor-compression refrigeration cycle.
What You Will Learn
By the end of this lesson you should be able to:
Explain what a pressure-enthalpy diagram represents.
Recognize pressure and enthalpy as the two primary axes used to describe refrigerant condition.
Identify the saturation dome.
Locate the saturated-liquid boundary, saturated-vapor boundary, and liquid-vapor mixture region.
Identify refrigerant regions.
Recognize subcooled liquid, saturated refrigerant, and superheated vapor on the diagram.
Follow the four refrigeration processes.
Trace compression, condensation, expansion, and evaporation around the diagram.
Understand refrigeration effect.
Recognize the energy absorbed by the refrigerant in the evaporator.
Relate heat rejection to compressor work.
Understand why the condenser must reject both evaporator heat and energy added by the compressor.
A Map of Refrigerant Condition
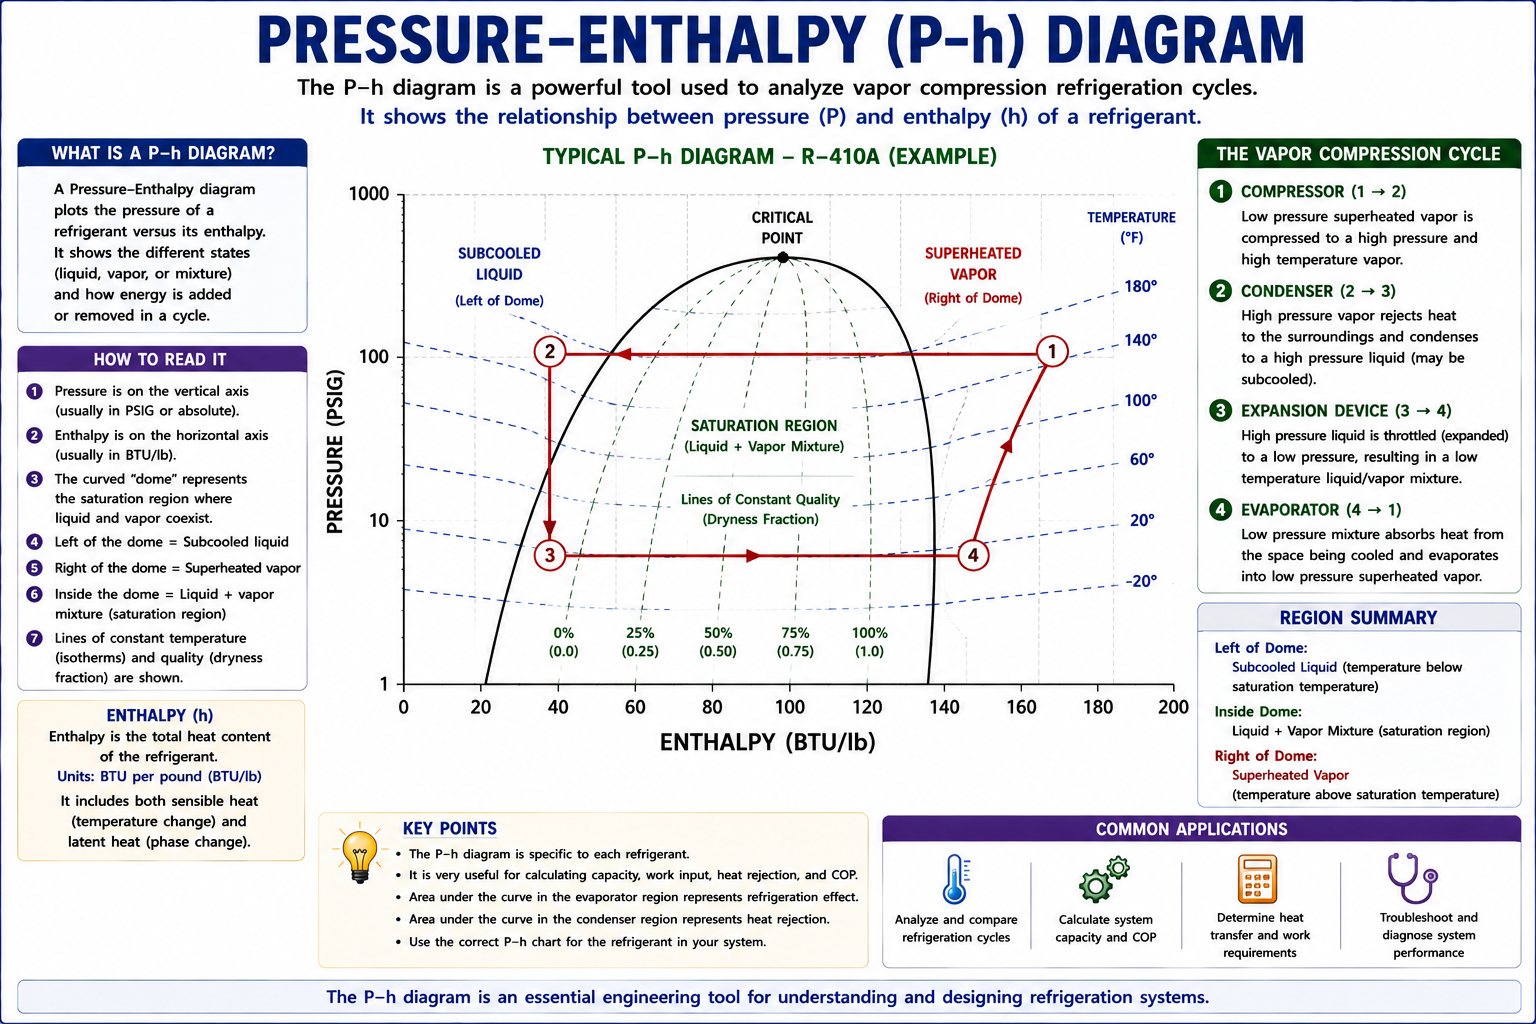
A pressure-enthalpy diagram is often abbreviated as a P-h diagram. It plots refrigerant pressure against enthalpy and provides a graphical way to follow the refrigerant through the refrigeration cycle.
Pressure
Pressure increases as you move upward on the diagram and decreases as you move downward.
Enthalpy
Enthalpy represents the energy content of the refrigerant, commonly expressed in BTU per pound.
For an introductory understanding, concentrate on the major regions, the saturation dome, and how the four refrigeration processes move through the diagram.
A Useful Measure of Refrigerant Energy
Enthalpy is a thermodynamic property used to describe the energy associated with a refrigerant at a particular condition.
In HVAC/R calculations, enthalpy is often expressed as BTU per pound. Differences in enthalpy allow us to determine how much energy each pound of refrigerant absorbs or rejects as it moves through a component.
Enthalpy entering a component
Enthalpy leaving a component
Energy change per pound of refrigerant
For many refrigeration calculations, we are interested in how much enthalpy changes across a component rather than simply knowing one enthalpy value by itself.
The Dome Separates Major Refrigerant Regions
The most recognizable feature of a pressure-enthalpy diagram is the saturation dome.
Saturated Liquid
The refrigerant is liquid and is just ready to begin vaporizing if additional heat is added.
Liquid + Vapor
Liquid and vapor exist together while evaporation or condensation is taking place.
Saturated Vapor
The final liquid has just vaporized and the refrigerant is entirely vapor.
The same saturation concepts learned in the pressure-temperature lessons appear here graphically. Inside the dome, refrigerant is undergoing a phase change.
Left of the Saturation Dome
Refrigerant located to the left of the saturated-liquid boundary is in the subcooled or compressed-liquid region.
Liquid temperature is below the saturation temperature corresponding to its pressure.
This is the condition normally desired in the liquid line after refrigerant leaves the condenser and before it reaches the metering device.
Subcooling is the temperature difference between the liquid-side saturation temperature and the actual liquid temperature. The P-h diagram shows that subcooled liquid exists outside the saturation dome.
Right of the Saturation Dome
Refrigerant located to the right of the saturated-vapor boundary is in the superheated-vapor region.
Vapor temperature is above the saturation temperature corresponding to its pressure.
Refrigerant leaving the evaporator normally enters the superheated region before traveling through the suction line to the compressor.
Superheat begins after the refrigerant reaches the saturated-vapor boundary and all liquid has completed vaporization.
The Complete Cycle Can Be Plotted on the Diagram
Compression
Low-pressure vapor becomes high-pressure, high-temperature vapor.
Condensation
High-pressure refrigerant rejects heat and becomes liquid.
Expansion
Pressure falls as refrigerant passes through the metering device.
Evaporation
Low-pressure refrigerant absorbs heat and becomes vapor.
Compression
The compressor receives low-pressure refrigerant vapor and compresses it to a higher pressure.
Low-Pressure Vapor
Refrigerant enters as superheated vapor.
High-Pressure Vapor
Pressure, temperature, and enthalpy have increased.
Compression requires mechanical work. That added energy becomes part of the heat that must eventually be rejected by the condenser.
Condensation and Heat Rejection
High-pressure vapor enters the condenser and rejects heat to outdoor air, water, or another cooling medium.
Desuperheating
Superheated discharge vapor cools toward the high-side saturation condition.
Condensation
Refrigerant rejects latent heat while changing from vapor to liquid inside the saturation dome.
Subcooling
After all vapor has condensed, additional heat removal cools the liquid below saturation temperature.
The condenser normally handles sensible cooling of superheated vapor, latent heat rejection during condensation, and additional sensible cooling that produces subcooled liquid.
Expansion Through the Metering Device
High-pressure liquid passes through the metering device and enters the low-pressure side of the refrigeration system.
High-Pressure Liquid
Subcooled or saturated liquid approaches the metering device.
Metering Device
Pressure drops rapidly.
Low-Pressure Mixture
Some liquid flashes into vapor as the refrigerant enters the evaporator.
The metering device creates the pressure reduction needed for the evaporator, but the primary useful refrigeration effect occurs after the refrigerant enters the evaporator and absorbs heat from the load.
Evaporation and Refrigeration Effect
Low-pressure refrigerant enters the evaporator as a liquid-vapor mixture and absorbs heat from the conditioned space or refrigerated product.
Mixture Enters
Low-pressure liquid and vapor enter the evaporator.
Liquid Vaporizes
Refrigerant absorbs latent heat while moving across the saturated region.
Vapor Superheats
After the final liquid evaporates, additional heat increases vapor temperature.
The useful heat absorbed by each pound of refrigerant as it passes through the evaporator is called the refrigeration effect.
How Much Heat Each Pound of Refrigerant Absorbs
The pressure-enthalpy diagram allows the energy absorbed in the evaporator to be determined from the difference between refrigerant enthalpy entering and leaving the evaporator.
Small Enthalpy Difference
Each pound of refrigerant absorbs less heat.
Larger Enthalpy Difference
Each pound of refrigerant absorbs more heat through the evaporator.
The Compressor Adds Energy to the Refrigerant
The compressor increases refrigerant enthalpy as mechanical work is added during compression.
The evaporator provides the useful cooling effect. The compressor supplies the work needed to create the pressure difference that allows the evaporator and condenser to operate at useful temperatures.
The Condenser Rejects More Heat Than the Evaporator Absorbs
The condenser must reject the heat absorbed in the evaporator plus the energy added by the compressor.
Refrigeration Effect
Heat absorbed in the evaporator
Compression Energy
Energy added by the compressor
Total Heat Rejection
Heat rejected by the condenser
An air-conditioning condenser must reject both the heat removed from the indoor space and the energy added to the refrigerant by the compressor.
Everything From This Section Appears on the Diagram
Pressure
The vertical axis shows high-side and low-side pressure levels.
Saturation
The dome identifies the region where liquid and vapor coexist.
Latent Heat
Evaporation and condensation cross the phase-change region.
Superheat
Superheated vapor appears to the right of the saturated-vapor boundary.
Subcooling
Subcooled liquid appears to the left of the saturated-liquid boundary.
Capacity
Enthalpy difference through the evaporator helps determine refrigeration effect and system capacity.
One Trip Around the P-h Diagram
Evaporator Outlet / Compressor Inlet
Low-pressure superheated vapor enters the compressor.
Compressor Outlet
High-pressure, high-temperature superheated vapor enters the condenser.
Condenser Outlet
High-pressure liquid leaves the condenser, commonly with measurable subcooling.
Metering Device Outlet
Low-pressure liquid-vapor mixture enters the evaporator.
The Cycle Repeats
The refrigerant absorbs heat, vaporizes, becomes superheated, and returns to the compressor.
You May Not Plot Every Service Call — But the Diagram Explains the System
A technician may rarely need to manually plot a complete pressure-enthalpy diagram during an ordinary residential service call. The value of the diagram is that it visually connects concepts that otherwise seem unrelated.
Explains Component Function
Shows exactly what changes across the compressor, condenser, metering device, and evaporator.
Connects Pressure and State
Shows why pressure alone does not completely describe refrigerant condition.
Explains Superheat and Subcooling
Makes it clear that these conditions exist outside the saturation dome.
Explains Capacity
Shows how enthalpy difference through the evaporator represents heat absorbed per pound of refrigerant.
What You Do Not Need to Master Yet
A complete pressure-enthalpy diagram may contain constant-temperature lines, quality lines, constant-entropy lines, constant-volume lines, and other information used for detailed engineering analysis.
Those features are useful, but they are beyond what is necessary for this introductory Refrigeration Theory section.
Avoid These Pressure-Enthalpy Errors
“The saturation dome is the refrigeration cycle.”
No. The dome identifies refrigerant phase regions. The refrigeration cycle travels through and around those regions.
“Refrigerant is saturated everywhere in the system.”
No. Suction vapor can be superheated and liquid refrigerant can be subcooled.
“The condenser only performs condensation.”
The condenser can desuperheat vapor, condense refrigerant, and subcool liquid.
“The evaporator only performs evaporation.”
The evaporator boils liquid refrigerant and can also add superheat after vaporization is complete.
“The metering device removes heat from the building.”
The metering device creates the pressure reduction. Useful heat absorption occurs primarily in the evaporator.
“Condenser heat rejection equals evaporator heat absorption.”
The condenser must reject evaporator heat plus the energy added during compression.
Can You Follow the Refrigeration Cycle on a P-h Diagram?
- What does the vertical axis of a pressure-enthalpy diagram represent?
- What does the horizontal axis represent?
- What is enthalpy commonly expressed in for U.S. refrigeration calculations?
- What does the left side of the saturation dome represent?
- What does the right side of the saturation dome represent?
- What exists inside the saturation dome?
- Where is subcooled liquid found relative to the saturation dome?
- Where is superheated vapor found relative to the saturation dome?
- What happens to pressure and enthalpy during compression?
- What three general processes can occur in the condenser?
- What happens to refrigerant pressure across the metering device?
- What happens to refrigerant in the evaporator?
- What is refrigeration effect?
- What does the compressor add to the refrigerant?
- Why must condenser heat rejection be greater than evaporator heat absorption?
- Why is understanding the pressure-enthalpy diagram useful even if a technician does not manually plot one during every service call?
What You Should Have Learned
A pressure-enthalpy diagram plots refrigerant pressure against enthalpy.
The saturation dome identifies saturated liquid, saturated vapor, and the liquid-vapor mixture region.
Subcooled liquid exists to the liquid side of the dome, while superheated vapor exists to the vapor side.
Compression raises refrigerant pressure and adds energy to the refrigerant vapor.
The condenser desuperheats vapor, condenses refrigerant, and may subcool the resulting liquid.
The metering device creates the major pressure reduction between the high and low sides.
The evaporator absorbs heat while refrigerant vaporizes and then becomes superheated.
Refrigeration effect represents the heat absorbed by each pound of refrigerant through the evaporator.
The compressor adds energy that must eventually be rejected by the condenser.
Total condenser heat rejection equals the heat absorbed in the evaporator plus the energy added by compression.