PV System Ratings, Production, and Aging
A photovoltaic system does not produce its nameplate rating continuously. Module ratings are established under standardized conditions, while an operating array is exposed to changing sunlight, temperature, weather, shading, orientation, equipment losses, and seasonal conditions.
For a service technician, understanding these differences is essential before diagnosing a low-production complaint. The goal is to determine whether the system is actually underperforming or whether the measured output is reasonable for the equipment, environmental conditions, time of day, season, and age of the installation.
Rated Output Is a Reference Point
A module labeled 400 watts is capable of producing approximately its rated power under defined test conditions. It does not mean a technician should expect to measure exactly 400 watts from that module every time the sun is shining.
Actual PV production changes continuously. Solar irradiance changes as the sun moves across the sky. Cell temperature changes. Clouds pass over the array. Shading moves. Seasons affect sun angle and available daylight. Dirt, snow, electrical losses, equipment condition, and normal aging can further influence production.
The technician should therefore compare actual output with a reasonable expected value rather than treating the maximum nameplate rating as a guaranteed field reading.
Read the Nameplate Before Evaluating Performance
The module nameplate or manufacturer specification sheet provides the electrical characteristics needed to understand the module. These values also help establish reasonable expectations for string voltage, current, and power when modules are electrically combined.
Pmax — Maximum Power
The rated maximum electrical power of the module under the specified test conditions, expressed in watts.
Voc — Open-Circuit Voltage
The module voltage when its output circuit is open and essentially no load current is flowing.
Vmp — Maximum-Power Voltage
The approximate voltage at which the module produces maximum rated power under the specified test conditions.
Isc — Short-Circuit Current
The current rating under specified short-circuit test conditions. This is a specification value, not an instruction to short-circuit a module during routine troubleshooting.
Imp — Maximum-Power Current
The approximate current at the module’s maximum-power operating point under the specified test conditions.
Temperature Coefficients
Manufacturer values that describe how electrical characteristics change as module or cell temperature changes.
Know What the Rating Represents
PV module power ratings are commonly established under Standard Test Conditions, often abbreviated STC. Standardized conditions allow modules to be compared using the same basic reference.
Solar Irradiance
STC uses solar irradiance of 1,000 watts per square meter.
Cell Temperature
STC uses a photovoltaic cell temperature of 25°C, or 77°F.
Standardized Conditions
The rating environment is controlled so modules can be compared consistently.
Field Conditions
An installed module rarely operates continuously at those exact conditions, so field output naturally differs from the STC rating.
Technician point: A module rated at 400 watts is not defective simply because it is producing less than 400 watts in the field. First determine the conditions under which the measurement was taken.
Do Not Confuse kW With kWh
PV discussions frequently use both kilowatts and kilowatt-hours. They describe different quantities and should not be used interchangeably.
kW — Power
Kilowatts describe the rate at which electrical power is being produced or consumed at a particular time.
kWh — Energy
Kilowatt-hours describe the total electrical energy produced or consumed over a period of time.
Power Over Time
If a PV system averages 4 kW of output for three hours, it produces approximately 12 kWh of electrical energy during that period.
4 kW × 3 hours = 12 kWh
DC Array Rating and AC Inverter Rating May Differ
The sum of the module ratings establishes the approximate DC nameplate capacity of the array. The inverter has its own AC output rating. These values are related, but they are not necessarily identical.
A PV installation may intentionally contain more rated DC module capacity than the inverter’s maximum continuous AC output capability. The inverter operates within its design limits even when the connected array has a higher nominal DC wattage.
Do not diagnose a fault simply because array DC wattage and inverter AC wattage are different. Use the actual equipment specifications for the installed system.
Available Solar Energy Strongly Affects Production
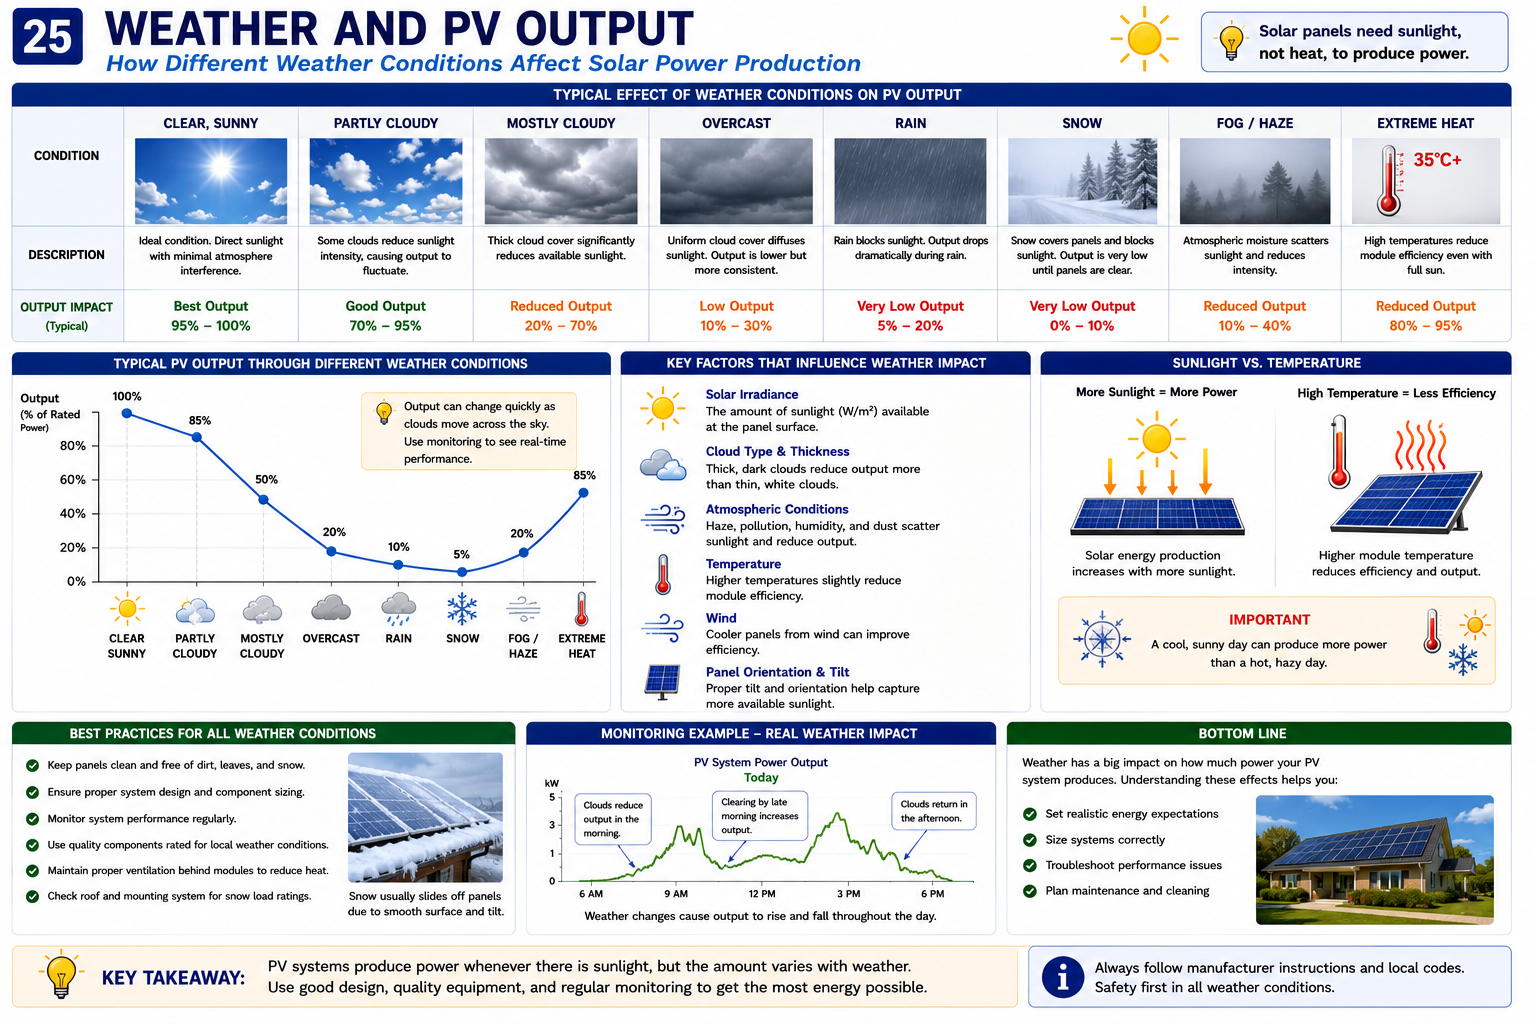
The electrical power available from a PV module depends heavily on the solar energy reaching its surface. Strong direct sunlight can support high production, while clouds, haze, smoke, fog, shading, and low sun angles reduce the available solar energy.
Production can change rapidly as cloud conditions change. A system may show strong output and then decline substantially within moments as a cloud crosses the array. Production may rise again just as quickly when direct sunlight returns.
Field point: Record weather and solar conditions whenever meaningful production measurements are taken. A power reading without the environmental conditions can easily be misinterpreted later.
Bright Sunlight Does Not Automatically Mean Maximum Power
PV modules can become considerably hotter than the surrounding air when exposed to strong sunlight. As cell temperature increases, module voltage generally decreases.
This is why a cool, clear day can sometimes produce excellent PV output even though the ambient temperature is lower than on a very hot summer afternoon.
Higher Temperature
Module voltage normally decreases as cell temperature increases.
Lower Temperature
Module voltage normally increases as cell temperature decreases.
Current
Module current also changes with operating conditions, but available irradiance generally has a much stronger effect on current than temperature alone.
Manufacturer Data
Use the module’s published temperature coefficients when a more precise evaluation is required.
PV Output Normally Rises and Falls Throughout the Day
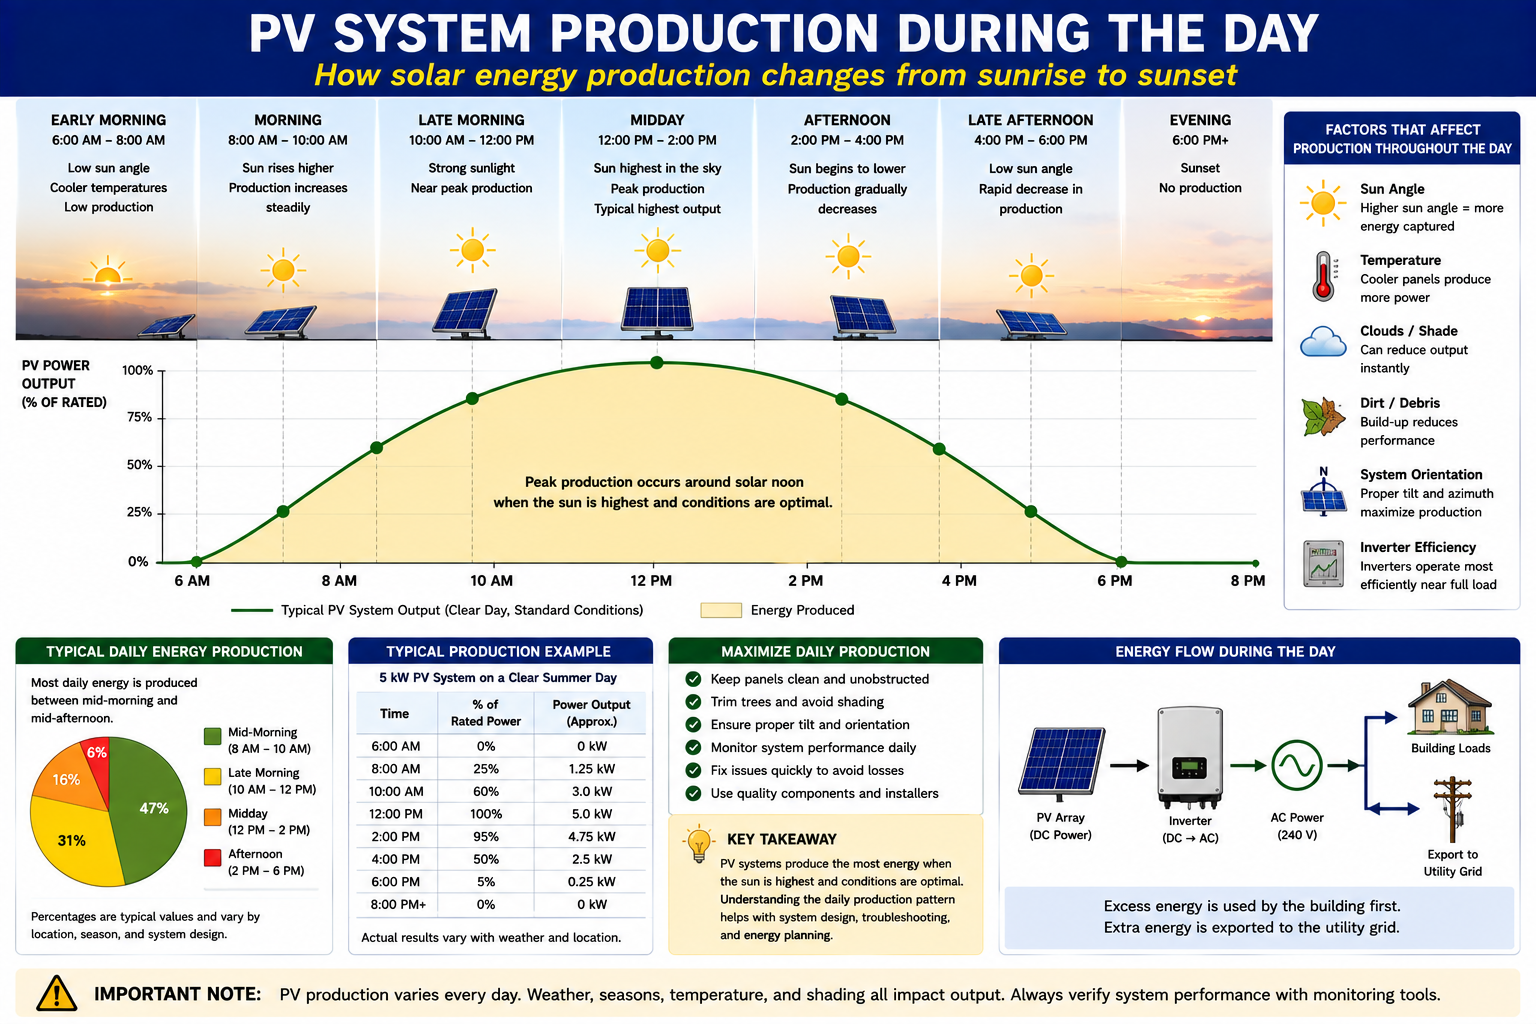
On a clear day, PV production normally begins at a low level after sunrise, increases as solar conditions improve, reaches its strongest levels during the higher-sun portion of the day, and declines again toward sunset.
The exact production profile depends on array orientation, tilt, location, shading, weather, temperature, system architecture, and other operating conditions.
Look at the Pattern, Not Just One Number
Monitoring data can be especially useful because it shows performance over time. A daily production curve can reveal normal operating patterns as well as conditions that deserve further investigation.
Morning
Production begins low and increases as the sun rises and irradiance at the modules improves.
Late Morning
Output normally increases substantially as solar exposure improves.
Midday
Production may approach its strongest level when irradiance, array orientation, temperature, and inverter limitations allow it.
Afternoon
Production normally begins declining as sun angle and available irradiance decrease.
Evening
Production approaches zero as usable sunlight disappears from the array.
Short-Term Production Changes Can Be Normal
Moving clouds can produce rapid fluctuations in PV output. This does not automatically indicate an intermittent electrical fault.
When possible, compare electrical readings while irradiance conditions remain relatively stable. If cloud conditions are changing rapidly, record that fact with the measurement.
Record the Conditions
A measurement of 3.2 kW has limited diagnostic meaning by itself. Record whether the array was in full sunlight, light cloud, heavy cloud, partial shade, or another identifiable condition.
The environmental conditions help determine whether 3.2 kW represents expected operation or possible underperformance.
Different Parts of the Array May Receive Different Sunlight
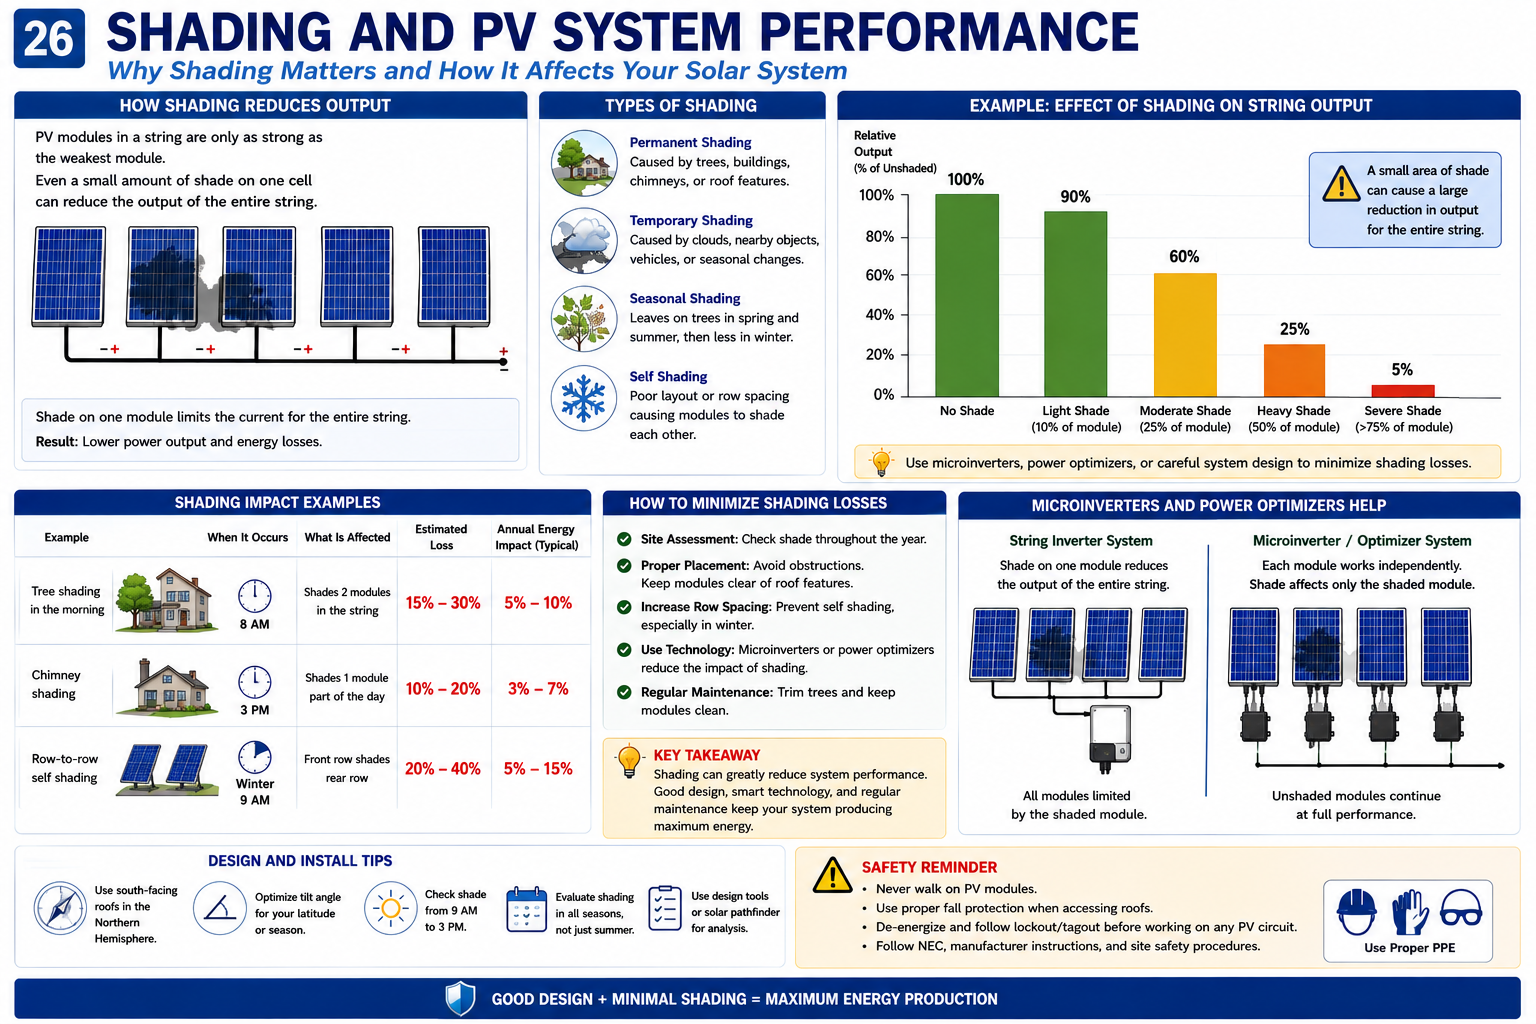
Shading can come from trees, buildings, chimneys, vents, antennas, adjacent roof sections, utility equipment, snow, vegetation, or temporary objects.
The effect of shading depends partly on the electrical architecture. Conventional strings, optimizer systems, and microinverter systems can respond differently because their modules are electrically managed differently.
Before comparing strings or modules, confirm that the circuits being compared are experiencing reasonably similar solar exposure.
Not Every Array Section Should Produce the Same Power at the Same Time
An installation may contain modules facing different directions or mounted at different angles. East-facing modules may produce more strongly earlier in the day, while west-facing modules may produce more strongly later in the afternoon.
A production difference between two array sections can therefore be normal even when both sections are functioning correctly.
Before comparing strings, determine whether they are truly comparable. Module type, module count, orientation, tilt, shading, inverter input, and current solar exposure all matter.
Production Changes Across the Year
Seasonal changes affect daylight duration, sun angle, temperature, weather patterns, shading, and the amount of solar energy available to the array.
For that reason, monthly production should usually be compared with similar periods from previous years rather than assuming every month should produce the same amount of energy.
Comparing June with the previous June may be more useful than comparing June directly with December.
Module Nameplate Watts Do Not Equal Delivered AC Watts
Some energy is lost as power moves through a real photovoltaic system. These losses can occur in the modules, conductors, connections, power electronics, inverter, and other equipment.
Module Temperature
Higher cell temperatures can reduce the electrical power available from the modules.
Wiring Loss
Conductors and electrical connections have resistance and therefore create some voltage and power loss.
Inverter Loss
Modern DC-to-AC conversion is efficient but is not perfectly lossless.
Mismatch
Differences between modules or operating conditions can reduce the combined output of electrically related components.
Soiling
Dirt, dust, pollen, bird deposits, leaves, and other material can reduce solar energy reaching the cells.
Equipment Availability
An inverter, string, optimizer, microinverter, or other system component that is offline for part of the day reduces total energy production.
PV Output Gradually Changes Over Time
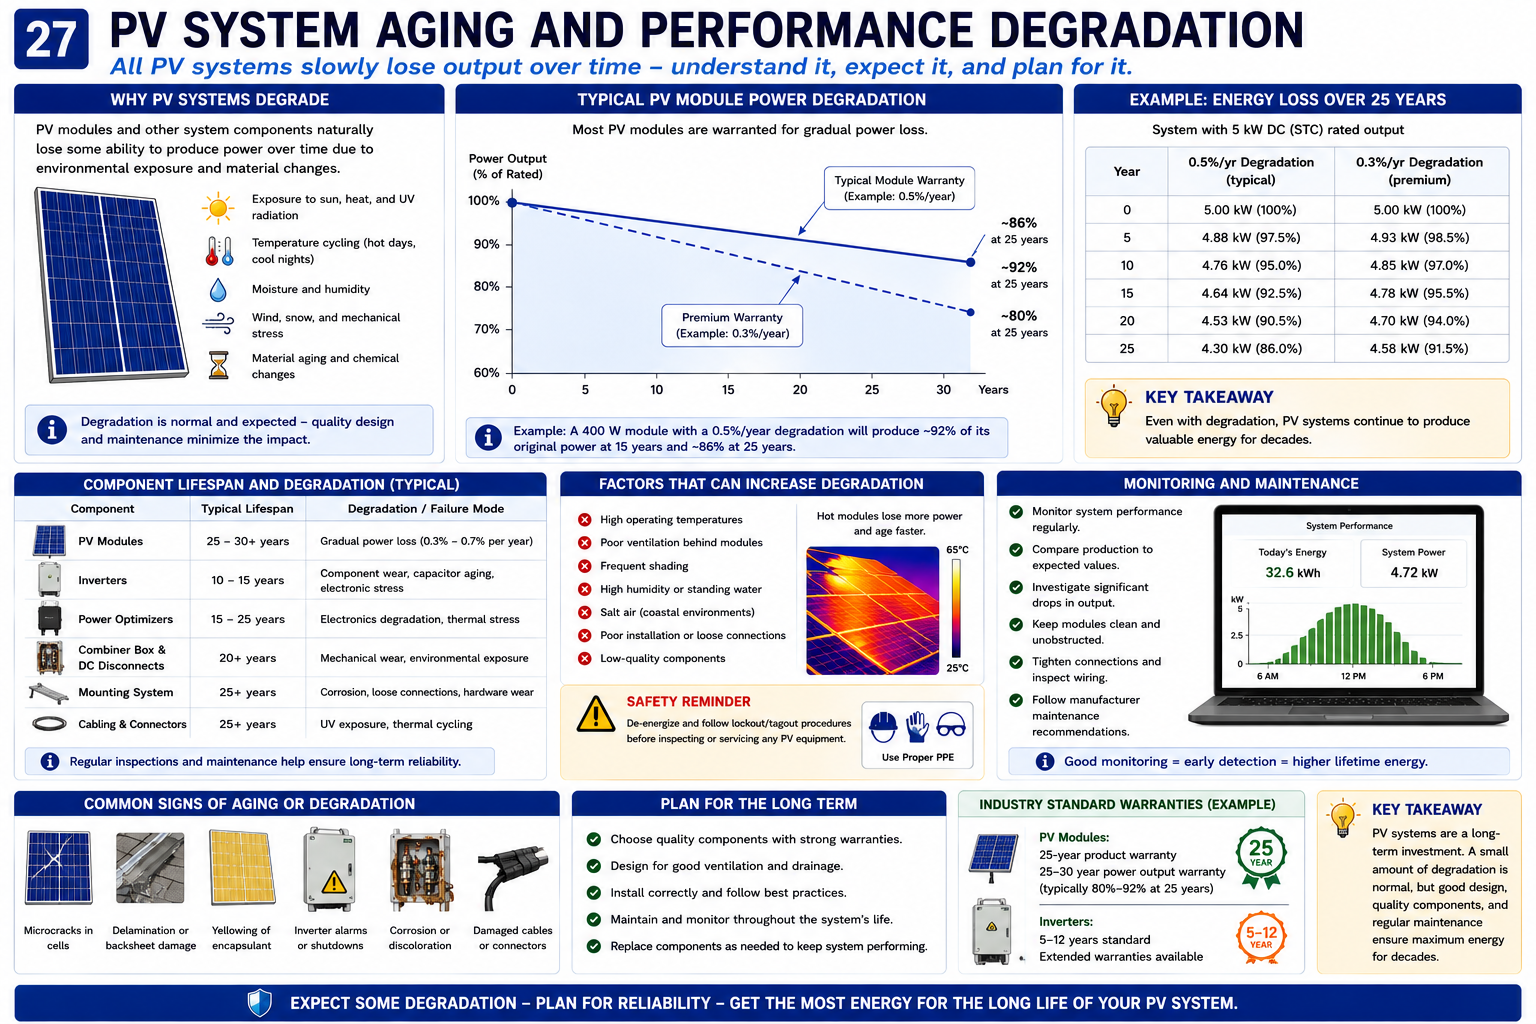
Photovoltaic modules are long-lived equipment, but electrical performance does not remain exactly the same forever. Years of exposure to ultraviolet radiation, temperature cycling, moisture, wind, snow, mechanical stress, and normal material aging gradually affect performance.
The technician should distinguish gradual age-related degradation from a sudden electrical failure. Normal degradation typically occurs slowly, while a failed circuit, damaged connection, failed inverter, or other fault can produce a much more abrupt change.
Degradation and Failure Are Different Conditions
A module that gradually produces somewhat less power after many years of service has not necessarily failed. Normal degradation occurs slowly.
A sudden large decrease in production, one string behaving very differently from comparable strings, a module with essentially no output, or an inverter abruptly going offline should be investigated as a possible electrical or equipment fault.
Do Not Focus Only on the Modules
The PV modules are only part of the system. Inverters, connectors, conductors, disconnects, surge devices, communications equipment, fans where used, capacitors, relays, optimizers, microinverters, and other electronics are also exposed to electrical, thermal, mechanical, and environmental stress.
An older installation with reduced or intermittent production therefore requires evaluation of the complete system rather than automatically attributing every change to module degradation.
Historical Production Can Be a Powerful Diagnostic Tool
Many PV systems record daily, monthly, and annual production. Some systems also provide inverter-level, string-level, optimizer-level, or module-level information.
Historical monitoring can help determine whether a reported change occurred suddenly, developed gradually, follows a recurring daily pattern, or corresponds with a specific device dropping offline.
Sudden Drop
A sharp change may indicate a failed circuit, inverter problem, protective-device operation, equipment fault, new shading condition, or another identifiable event.
Gradual Decline
A slow long-term reduction may include normal aging, increasing vegetation, soiling, equipment deterioration, or several factors occurring together.
Repeated Daily Pattern
A reduction that occurs at approximately the same time each day may indicate predictable shading or another sun-position-related condition.
Missing Device
Module-level monitoring may reveal one optimizer or microinverter that has stopped reporting while neighboring devices continue operating normally.
A Higher Utility Bill Is Not Yet a PV Diagnosis
A higher electrical bill does not by itself prove that solar production has decreased. Utility rates can change, building electrical use may increase, billing periods may differ, weather can affect loads, and customer behavior may change.
When possible, evaluate actual PV energy production in kWh and compare suitable historical periods rather than diagnosing the solar system from the dollar amount of the utility bill.
Technician rule: Diagnose the electrical system from production and operating evidence. The utility bill is not an electrical measurement.
Ask the Right Questions Before Calling It a Fault
What Is the System Rated For?
Record module count, module ratings, inverter ratings, string configuration, orientation, system age, and other useful equipment information.
What Are the Conditions Right Now?
Record sunlight, cloud cover, temperature, shading, time of day, and other environmental conditions affecting production.
Is the Entire System Low?
Determine whether the problem affects the complete installation or only one inverter, string, array section, optimizer, microinverter, or module.
What Does Historical Production Show?
Look for sudden changes, seasonal patterns, repeated daily reductions, missing devices, and long-term trends.
How Old Is the System?
Account for reasonable age-related degradation without using system age as an explanation for an obvious electrical fault.
Does the Evidence Support a Fault?
After expected operation has been established, proceed toward electrical testing when the actual performance cannot reasonably be explained by operating conditions.
Expected Production Comes Before Low-Production Troubleshooting
The statement “this is a 10 kW system and it is only making 6 kW” does not contain enough information to diagnose a fault.
A 6 kW reading may be perfectly reasonable under the current sunlight, temperature, orientation, shading, season, system age, and inverter operating conditions. It may also indicate meaningful underperformance.
The technician’s job is to gather enough information to distinguish between those two situations.
Production Measurements Still Involve an Energized PV System
Understanding expected output does not change the electrical hazards of the installation. Illuminated modules can produce DC voltage and current, utility-connected equipment can contain AC voltage, and battery-equipped installations add stored electrical energy.
Use appropriately rated instruments, identify all available sources of energy, follow manufacturer procedures and applicable electrical safe-work requirements, use required PPE, and verify electrical conditions before contact.
What You Should Take From This Lesson
Nameplate Power Is a Reference Rating
PV module ratings are established under specified test conditions and should not be interpreted as guaranteed continuous field output.
Production Changes Continuously
Sunlight, cloud cover, temperature, time of day, orientation, shading, weather, and season all influence PV production.
kW and kWh Are Different
kW describes power at a particular time, while kWh describes energy produced or consumed over a period of time.
Aging Is Normal
PV modules gradually lose some performance over many years, and other electrical components are also subject to aging and failure.
Use Historical Data
Production trends can help distinguish a sudden system fault from weather, seasonal variation, shading, or normal long-term changes.
Establish Expected Output Before Diagnosing Low Output
A production number has limited diagnostic value until the technician understands the equipment rating and the conditions under which that number was obtained.
PV Solar System Fundamentals
You should now be able to identify the major PV system configurations, recognize modules, strings, and arrays, distinguish string inverters from microinverters and optimizers, trace electrical power flow, and interpret system ratings and production within reasonable operating conditions.
Part II moves from understanding the system to inspecting it. The next lesson develops a systematic visual-inspection process before electrical troubleshooting begins.
PV Solar System Fundamentals
Return to the Part I landing page for all six PV Solar System Fundamentals lessons.